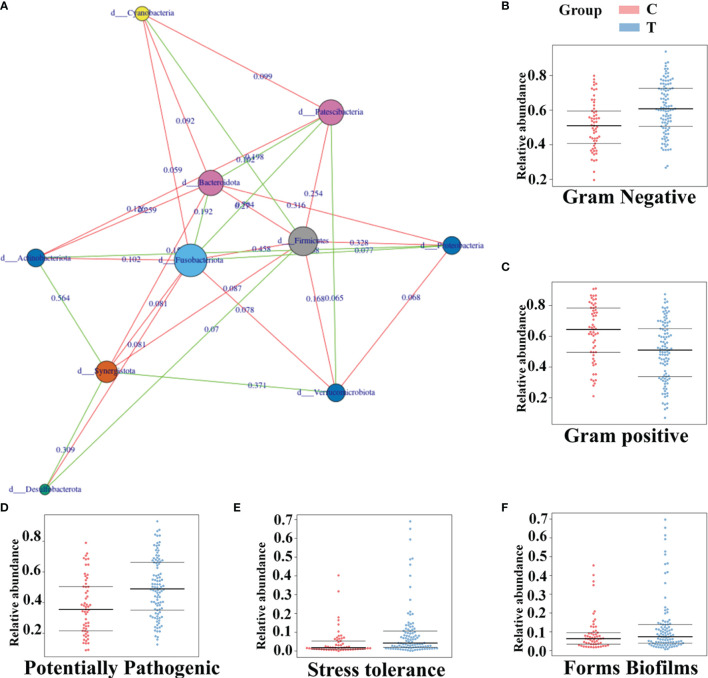
Figure 6.
The phenotypic characteristics of gut microbiota and the connection among them in brain tumor patients. The connection among different gut microbiota at the phylum level of brain tumor patients (A) Green represents positive correlation and red shows the negative. And the value on the line represents the association strength. The software of Bugbase was used to predict the phenotypic characteristics of the intestinal flora about Gram Negative (B) Gram positive (C) Potentially Pathogenic (D) Stress tolerance (E) Forms Biofilms (F) Each spot is a sample.

