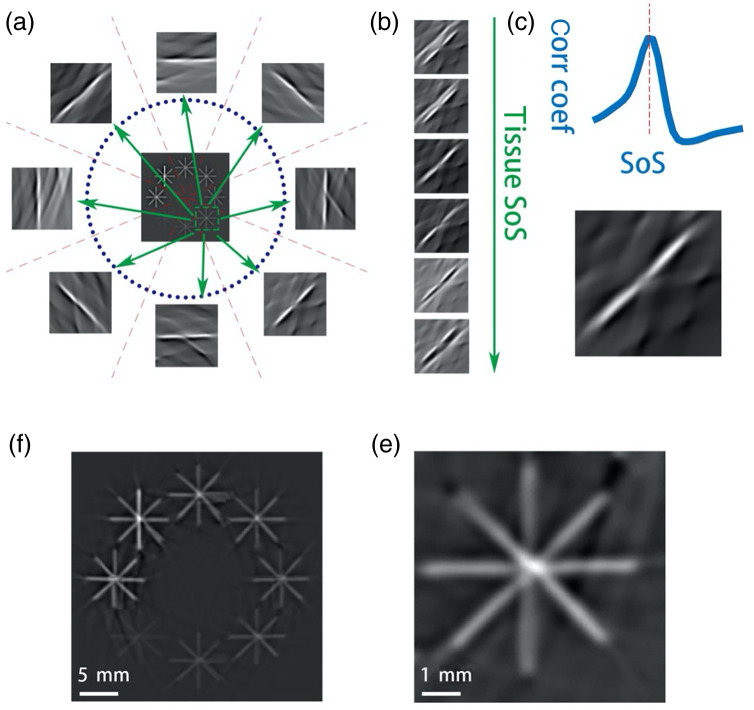
Fig. 1.
Diagram of the MSFC method. All images are obtained from numerical simulation. (a) Center: ground-truth initial pressure (IP) image. Blue dots: ultrasound transducer array positions. Outer: IP images of the region marked by the green dashed box reconstructed using signals detected by the eight sub-arrays. (b) A stack of images [of the region marked in (a)] reconstructed with increasing tissue SoS. All images are reconstructed using signals from the 4 o’clock to 10 o’clock sub-array pair. (c) Correlation coefficient between the images reconstructed using the 4 o’clock and 10 o’clock sub-arrays, plotted against the SoS. The peak determines the mean SoS along the 4 o’clock to 10 o’clock direction. (d) The image corresponding to the highest correlation coefficient. (e) The local image combining the results from all detectors. (f) The final reconstructed IP image by stitching all processed patches.

