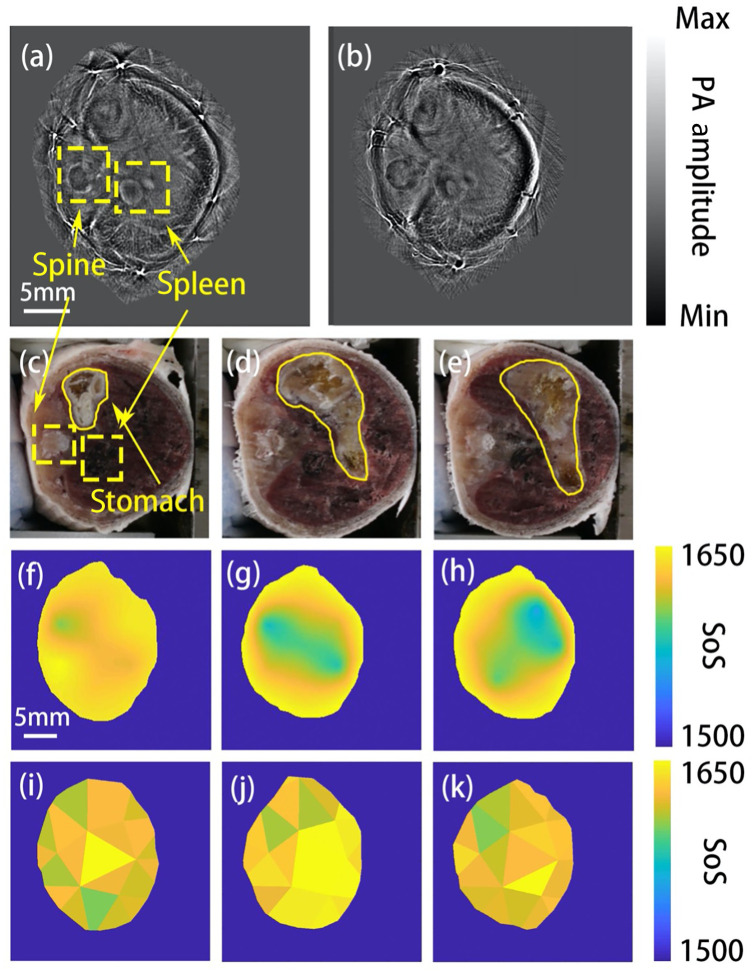
Fig. 4.
In vivo animal experiment results. (a) Image reconstruction result by MSFC. (b) Image reconstruction result by DAS. Both (a) and (b) correspond to the cryotomy photos of the mouse’s stomach. Spine and spleen are marked by yellow dashed line boxes, the corresponding region in the cryotomy photo. Panel (c) is also marked by a yellow dashed box. (c)–(e) The cryotomy photos of the mouse’s stomach roughly at the three imaged layers shown in (f)–(h). The white region is coconut oil, marked by the yellow solid line. (f)–(h) The estimated SoS distribution of corresponding layers. The speed of sound in the coconut oil region is lower. (i)–(k) The SoS estimation results at the same layers by the conventional FC method.

