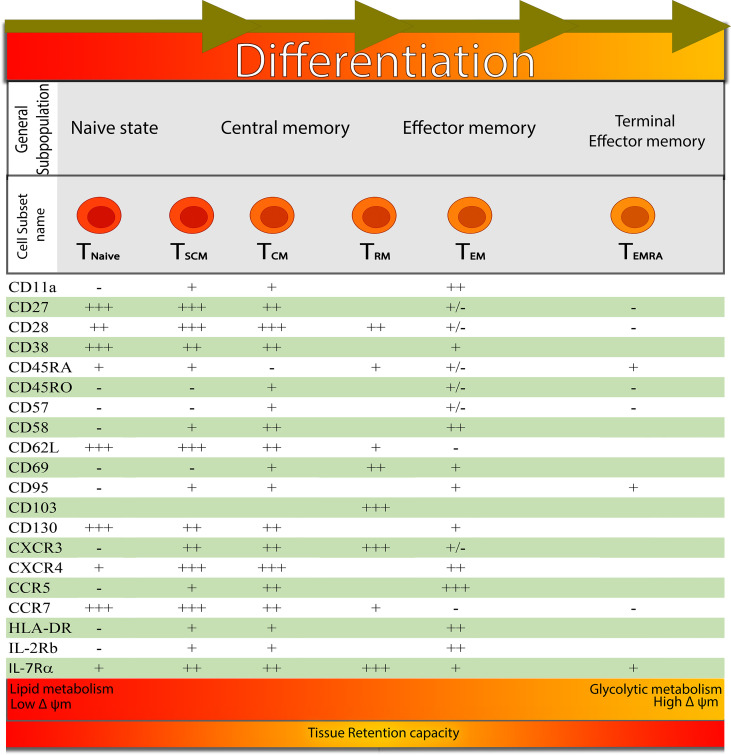
Figure 1.
Signatures for distinguishing the different developmental T cell stages: from left to right, it shows the different development stages of CD8+ T cell-based on the expression of surface markers. At the bottom of the figure, the main metabolic pathway and mitochondrial membrane potential that are favoured at the functional and phenotypic stage are represented by different coloured gradients (from red to orange), indicating that TRM cells have a larger tissue retention capacity.

