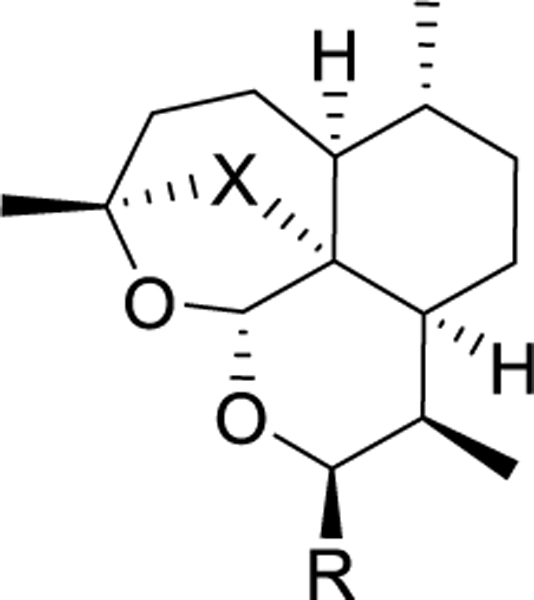
Table 1.
In vitro antimalarial activity of artemisinin derivatives against the P. falciparum asexual blood stages (PfABS) and cytotoxicity against HepG2.

| |||||
|---|---|---|---|---|---|
|
| |||||
| Compound | X | R | PfABS pEC50 (±S.D.) | Cytotoxicity pCC50 (±S.D.) | Selectivity Index |
|
| |||||
| 6a | O-O |

|
7.95 ( 0.14) | < 5.00 (0.00) | > 891 |
| 6b | O |

|
< 5.10 (0.21) | < 5.00 (0.00) | N.D. |
| 8a | O-O |

|
8.53 (0.34) | < 5.32 (0.28) | > 1620 |
| 8b | O |

|
< 5.00 (0.00) | < 5.00 (0.00) | N.D. |
| 11a | O-O |

|
9.22 (0.16) | < 5.00 (0.00) | > 16600 |
| 11b | O |

|
5.40 (0.14) | < 5.00 (0.00) | > 2.51 |
| artesunate | 8.95 (0.34) | 5.45 (0.34) | 3160 | ||
| artemisinin | 8.47 (0.32) | < 5.00 (0.00) | > 2950 | ||
| DHA | 9.06 (0.24) | < 5.07 (0.18) | > 9770 | ||
| puromycin | 7.33 (0.22) | 6.39 (0.24) | 8.71 | ||
Values represent mean (± standard deviation) from all independent experiments (n≥4 for PfABS, n≥3 for cytotoxicity). A value of <5.00 indicates inactivity at all concentrations tested; N.D. indicates not determined due to inactivity. If one or more result was <5, then pEC50 = 5 was used to determine the S.D..
