Figure 1.
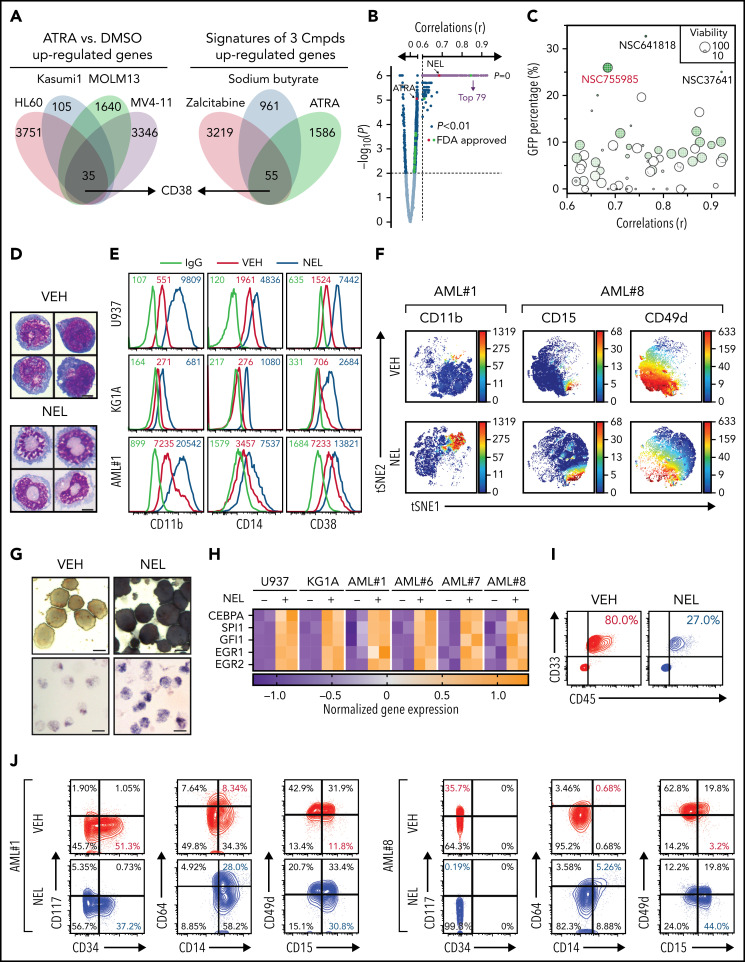
Functional screen reveals a differentiation-induction activity of nelarabine. (A) Venn plots depicting the approach to identify a differentiation marker by integrative analyses of GSE125112 dataset and CellMiner. Thirty-five genes were identified as overlapped upregulated genes after ATRA treatment in 4 AML lines (i); 55 genes were identified as overlapped upregulated genes among 3 differentiation-induction agents mediated gene expression profiles (ii). CD38 is the only overlapped gene from 2 lists. (B) Volcano plot showing Pearson correlations vs -Log10 P values for all compounds retrieved from CellMiner with CD38 as input. FDA-approved compounds are highlighted in green. Isotretinoin (ATRA) and nelarabine (NEL) are highlighted in red. Among the top 193 compounds (r > 0.6, P = 0, highlighted in purple), 79 available compounds were requested for further analysis. (C) Effects of 79 compounds on differentiation assessed by green fluorescent protein percentage in ER-HoxA9 cells. The diameter indicates the relative cell viability. Nelarabine (NSC755985) is highlighted in red. (D) Representative morphologic changes in ER-HoxA9 cells that accompanied myeloid differentiation shown by Wright-Giemsa staining of cells in the presence and absence of nelarabine treatment (10 µM, 96 hours). Scale bar, 5 μm. (E) Expression levels of surface markers CD11b, CD14, and CD38 in indicated cell lines and primary AML CD34+ cells (AML#1) after NEL treatment (U937, KG1A, 10 µM, 96 hours; AML#1, 20 µM, 96 hours). Mean fluorescence intensity is indicated in histograms. (F) Representative t-distributed stochastic neighbor embedding (tSNE) display of mass cytometry analyses of primary AML cells treated with NEL (20 µM, 96 hours), colored by expression of the indicated markers based on CD3−CD19− subsets. (G) Representative cytochemical staining of U937 cells after NEL treatment (10 µM, 96 hours) assessed by monocyte-specific α-naphthyl acetate esterase assay (i) and nitroblue tetrazolium reduction assay (ii). Scale bar, 15 μm. (H) Heatmap showing expressions of myeloid transcription factors in indicated AML cells after NEL treatment (U937, KG1A, 10 µM, 48 hours; AML#1, AML#6, AML#7, AML#8, 20 µM, 48 hours). Gene expression levels shown in duplicates were first normalized to GAPDH and then vehicle-treated cells. (I-K) Purified cells (1 × 10⁶ cells per mouse) from primary specimens AML#1 (CD34+ cells) and AML#8 (CD3+ depleted cells) were injected into sublethally irradiated NSGS mice. Following confirmation of >1% engraftment in peripheral blood (PB), mice were treated with NEL (217 mg/kg, IV, daily) or vehicle (PBS) for 2 weeks (n = 6 mice per group). Human cell engraftment was analyzed 12 weeks after bone marrow transplantation (BMT). Representative CD45 and CD33 expression in BM of xenografts (I), immunophenotype of the primitive subpopulation (CD34+ or CD117+), monocyte subpopulation (CD14+/CD64+), and neutrophil subpopulation (CD15+/CD49d−) (J), and percentage of human CD45+ cells in total BM (K) are shown. For panel K, results represent the mean ± SEM. **P < .01. (L-N) U937-lucifase cells (0.5 × 10⁶ cells per mouse) were injected into sublethally irradiated NSGS mice. Following engraftment confirmation, mice were treated with NEL (217 mg/kg, IV, daily) or vehicle (PBS) for 7 days (n = 9 per group) and then assessed for engraftment by in vivo bioluminescence imaging (L). Quantitative results from bioimaging (M) and mice survival after treatment discontinuation (N) are shown. For panel M, results represent mean ± SEM. ns, nonsignificant; **P < .01.


