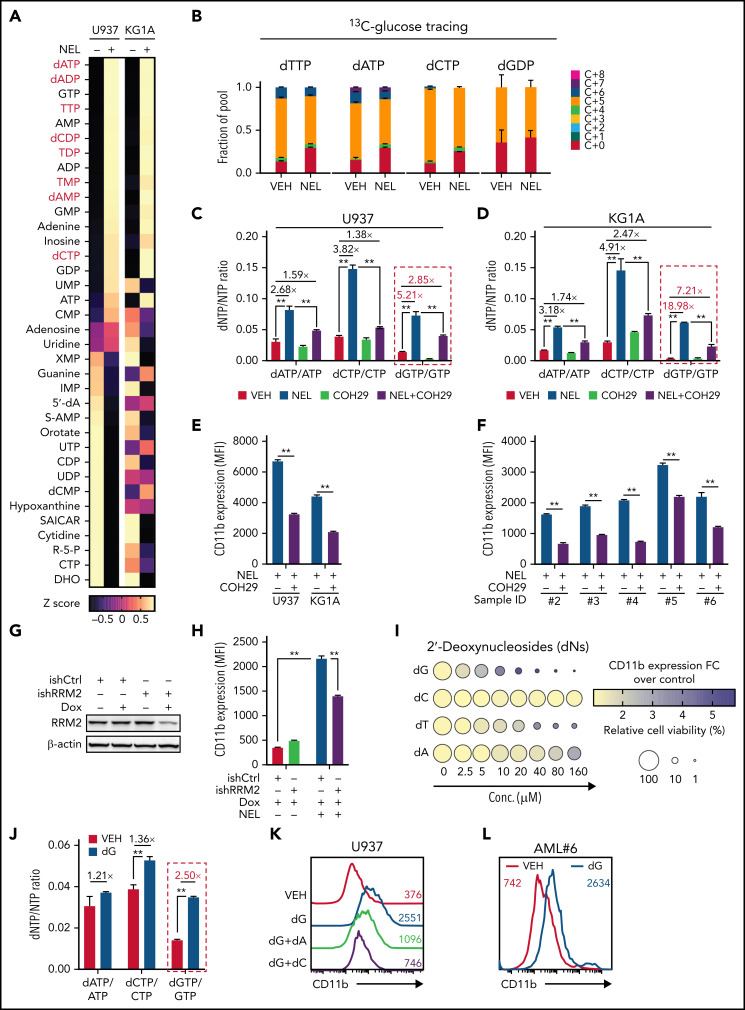
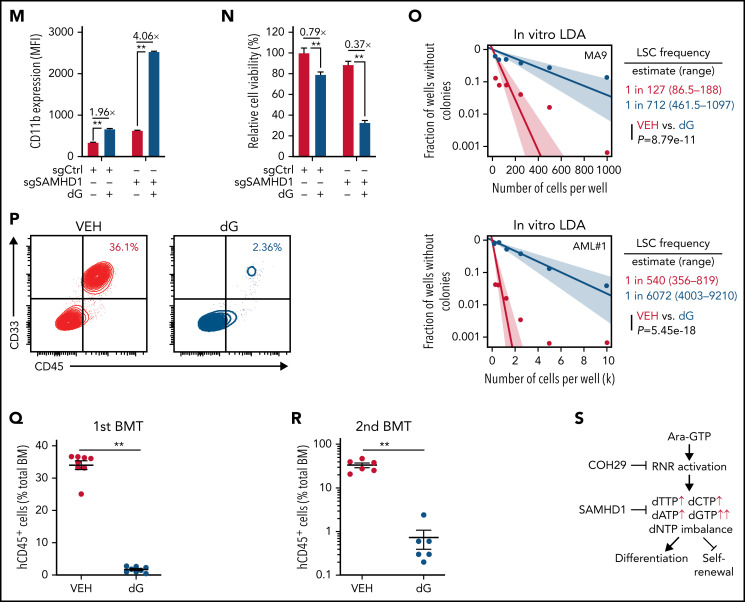
Figure 2.
NEL’s differentiation-induction is caused by dNTP imbalance. (A) Heatmaps showing changes of 36 intracellular nucleotide metabolites in U937 (i) or KG1A (ii) cells treated with vehicle or NEL (10 µM) for 12 hours. Commonly increased deoxynucleotides in both lines are highlighted in red. Data from duplicates are represented as Z-score–normalized intensities. (B) Fractional labeling of indicated deoxynucleotides in vehicle- or NEL-treated U937 cells cultured in media containing 13C-labeled glucose for 12 hours. The color indicates different isotopologues. Data from triplicates are normalized to total amounts of individual deoxynucleotides and represented as mean ± SEM. (C-D) U937 (C) and KG1A (D) were treated with vehicle, NEL (10 µM), COH29 (10 µM), or combination for 12 hours, and intracellular dNTP levels were quantified relative to their NTP counterparts by high-performance liquid chromatography/mass spectrometry (HPLC/MS). Numbers denote the fold changes of dNTP/NTP ratios relative to vehicle-treated controls. Results represent the mean ± SEM. **P < .01. (E-F) CD11b expression levels in indicated AML lines (E) or primary AML CD34+ cells (F) treated with NEL (U937 and KG1A, 10 µM, 96 hours; primary AML cells, 20 µM, 96 hours) in the absence or presence of COH29 (10 µM). Results represent mean ± SEM. **P < .01. (G) Western blot of RRM2 proteins in U937 cells transduced with inducible shRRM2 (ishRRM2) or shCtrl (ishCtrl) construct with or without doxycycline induction (2 µg/mL). (H) CD11b expression levels of ishCtrl- and ishRRM2-U937 cells with or without NEL treatment (10 µM, 96 hours) after doxycycline induction. Results represent mean ± SEM. **P < .01. (I) Relative cell viability and CD11b expression levels of U937 cells treated with gradually increasing doses of deoxynucleosides (dA, dT, dC, dG) for 48 hours. The color represents CD11b expression fold changes over vehicle control; the diameter indicates the relative cell viability. (J) U937 cells were treated with vehicle or dG (10 µM) for 12 hours, and intracellular dNTP levels were quantified relative to their NTP counterparts by HPLC/MS. Numbers denote the fold changes of dNTP/NTP ratios relative to vehicle-treated controls. Results represent mean ± SEM. **P < .01. (K) CD11b expression levels in U937 cells treated with vehicle, dG (10 µM), dG (10 µM) plus dA (10 µM), dG (10 µM) plus dC (10 µM) for 48 hours. (L) CD11b expression levels in primary AML CD34+ cells from specimen AML#6 treated with vehicle or dG (15 µM, 48 hours). (M-N) CD11b expression levels (M) and relative cell viability (N) of sgCtrl- and sgSAMHD1-THP1 cells treated with vehicle or dG (15 µM, 48 hours). Numbers denote the fold changes relative to vehicle-treated controls. Results represent mean ± SEM. **P < .01. (O) In vitro LDA assay showing LSC frequency changes in MA9+ primary murine AML cells (i) and primary AML CD34+ cells from specimen AML#1 (ii) after dG treatment (15 µM, 7 days). (P-R) Primary AML CD34+ cells (1 × 10⁶ cells per mouse) from specimen AML#1 were first treated with vehicle or dG (15 µM, 48 hours) ex vivo and then injected into sublethally irradiated NSGS mice (6-8 mice per group). Mice were killed 12 weeks after BMT for analysis of human cell engraftment, followed by secondary transplantation. Representative CD45 and CD33 expression in BM of primary transplants (P), percentage of human CD45+ cells in BM of primary recipient mice (Q), and secondary recipient mice (R) are shown. For panels Q and R, results represent mean ± SEM. **P < .01. (S) A working model depicting how dNTP imbalance overcomes differentiation blockade and impairs LSC self-renewal. As an active metabolite of NEL, Ara-GTP disrupts dNTP pool homeostasis through promoting RNR activity. COH29 treatment reverses the differentiation phenotype by inhibiting RNR activity, whereas SAMHD1 antagonizes increases of dNTP levels.


