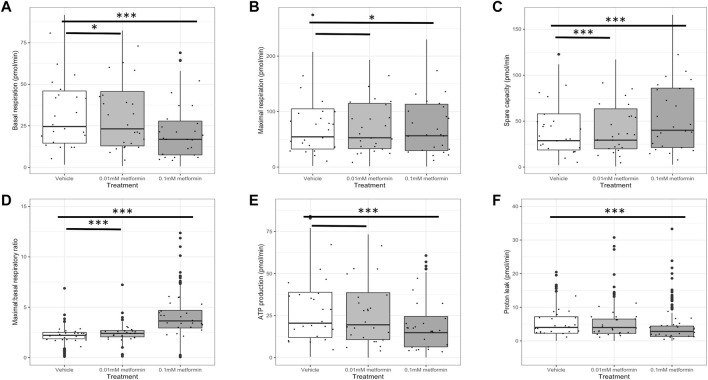
FIGURE 3.
Respiratory parameters in trophoblasts: metformin (0.01 mM or 0.1 mM) versus control (n = 24 per group). Values are derived from parameter calculations comparing the oxygen consumption rate (OCR) under various conditions and expressed as pmol O2 consumed per minute. An example of the full stress test profiles obtained is presented as Supplementary Figure S1. (A) Basal respiration, defined as O2 consumption when respiring under normal conditions with non-mitochondrial O2 consumption subtracted; (B) Maximal respiration, defined as maximal respiratory rate measured following addition of an uncoupling agent with non-mitochondrial O2 consumption subtracted; (C) Spare respiratory capacity, defined as maximal respiration with basal respiration subtracted; (D) Ratio of maximal to basal respiratory capacity; (E) mitochondrial-dependent ATP production, defined as O2 consumption when respiring under normal conditions minus the rate after addition of an ATP synthase inhibitor; (F) Proton leak, defined as the minimal rate of respiration after addition of an ATP synthase inhibitor with non-mitochondrial O2 consumption subtracted. p values are derived from mixed hierarchal regression models with fixed effect for treatment groups and random effect for placenta-of-origin. ***p < 0.001, *p < 0.05, line only p < 0.1.

