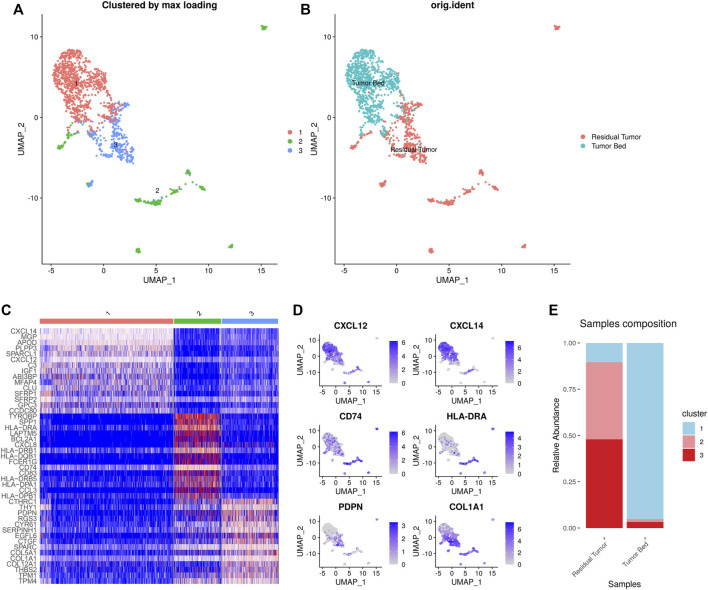
FIGURE 4.
Heterogeneity of CAFs in OSCC after ICT. UMAP plot showing the subclusters divided using NMF (A) and the original ident (B). Marker genes expression shown in heatmap. C1 CAFs expressed CXCL12, CXCL14, and IGF1. C2 CAFs expressed CD74 and MHC-Ⅱ. C3 CAFs expressed PDPN and COL1A1 (C). Feature plots showing CXCL12, CXCL14, CD74, HLA-DRA, PDPN, COL1A1 expression in CAFs (D). The proportion of subclusters in residual tumor and tumor bed. C1 CAFs were mainly enriched in tumor bed and C2 and C3 CAFs were enriched in residual tumor (E).

