
FIGURE 2.
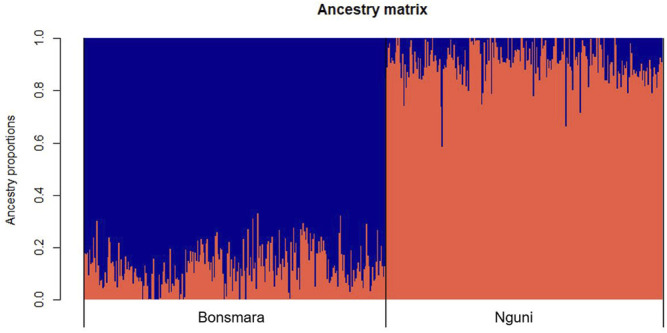
Ancestry matrix of Nguni and Bonsmara populations. Shown in the figure is the ancestry bar plot using sparse nonnegative matrix factorization (sNMF).
Official websites use .gov
A
.gov website belongs to an official
government organization in the United States.
Secure .gov websites use HTTPS
A lock (
) or https:// means you've safely
connected to the .gov website. Share sensitive
information only on official, secure websites.
Ancestry matrix of Nguni and Bonsmara populations. Shown in the figure is the ancestry bar plot using sparse nonnegative matrix factorization (sNMF).