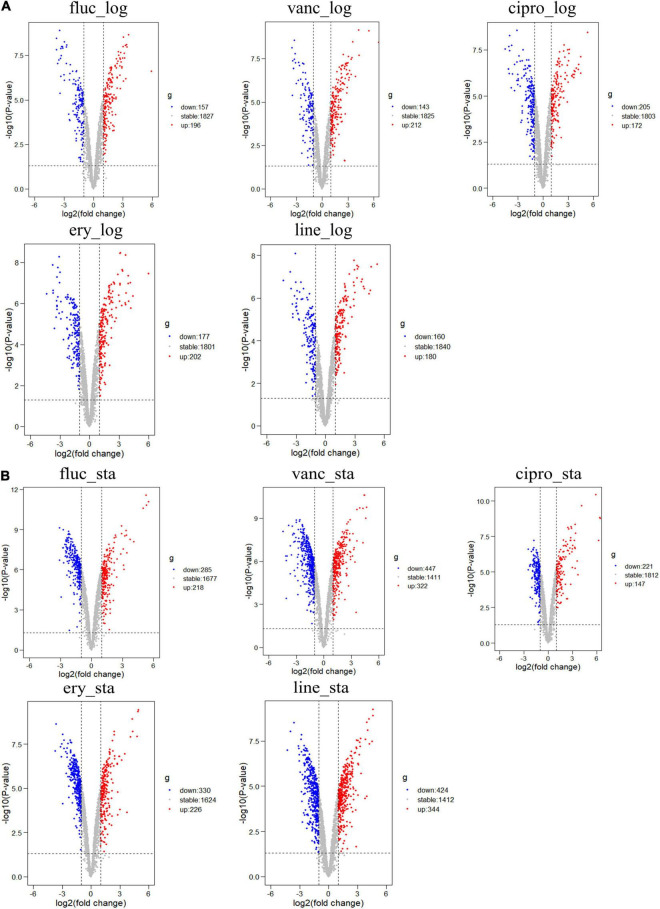
FIGURE 2.
Differential expression of five different antimicrobials treated samples in logarithmic phase and stationary phase. (A) DEGs in logarithmic phase (B) DEGs in stationary phase. The red points represent upregulated genes screened based on log2 fold change > 1 and a corrected p < 0.05. The blue points represent the downregulation of the expression of genes screened based on log2 fold change < –1 and a corrected p < 0.05. The gray points represent genes with no significant differences.

