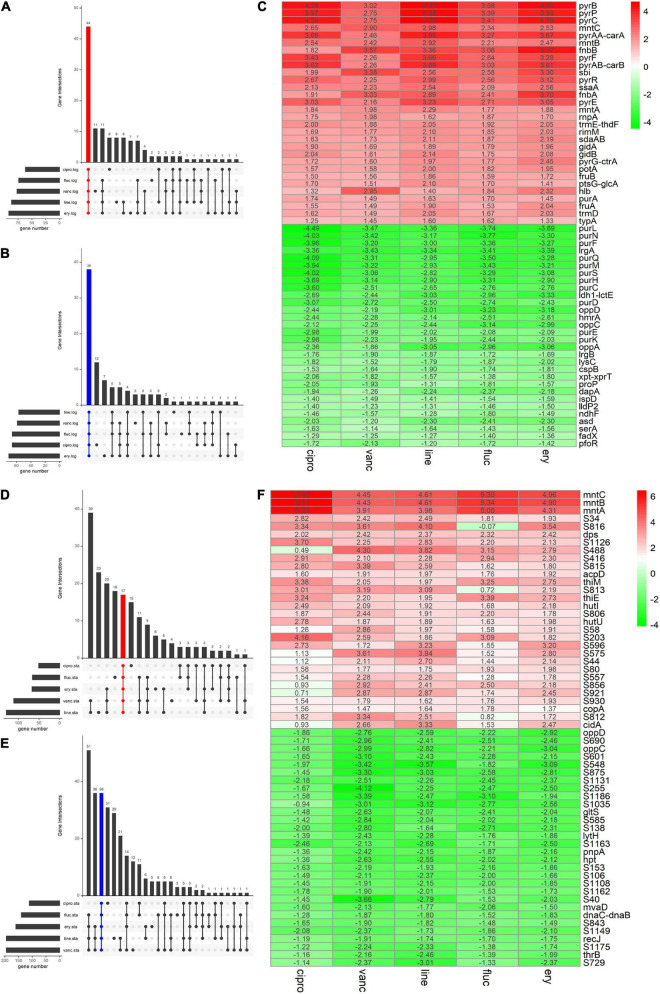
FIGURE 3.
The Venn diagram and the Heatmap of the integrated DEGs (A,B) number of integrated up- and downregulated genes in the logarithmic phase are shown in a Venn diagram. (D,E) Number of integrated up- and downregulated genes of stationary phase shown in a Venn diagram. (C) Heatmap of the top 30 up- and downregulated genes in logarithmic phase. (F) Heatmap of the top 30 up- and downregulated genes in stationary phase. The abscissa is the antimicrobials, and the ordinate is the gene name. Red represents log2 FC > 0, green represents log2 FC < 0, and the values in the box represent the log2 FC values.

