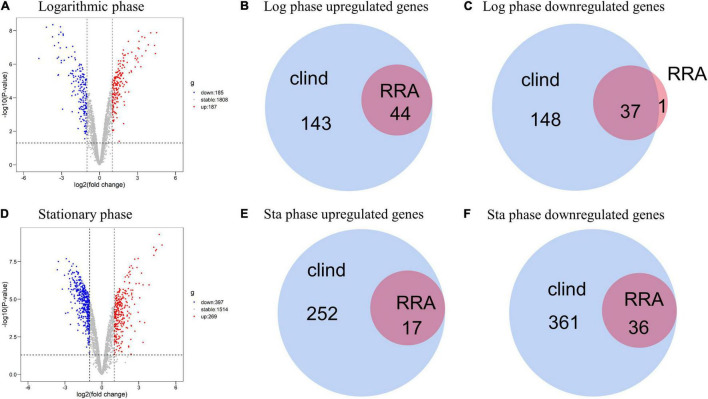
FIGURE 4.
Volcano plots of DEGs for clindamycin treated samples and Venn diagrams of DEGs identified in clindamycin treated samples and integrated data. (A) Volcano plots of DEGs identified in clindamycin treated samples during the logarithmic phase. (B,C) Venn diagrams of DEGs identified in clindamycin treated samples and integrated data during the logarithmic phase. (D) Volcano plots of DEGs identified in clindamycin treated samples during stationary phase. (E,F) Venn diagrams of DEGs identified in clindamycin treated samples and integrated data during stationary phase.

