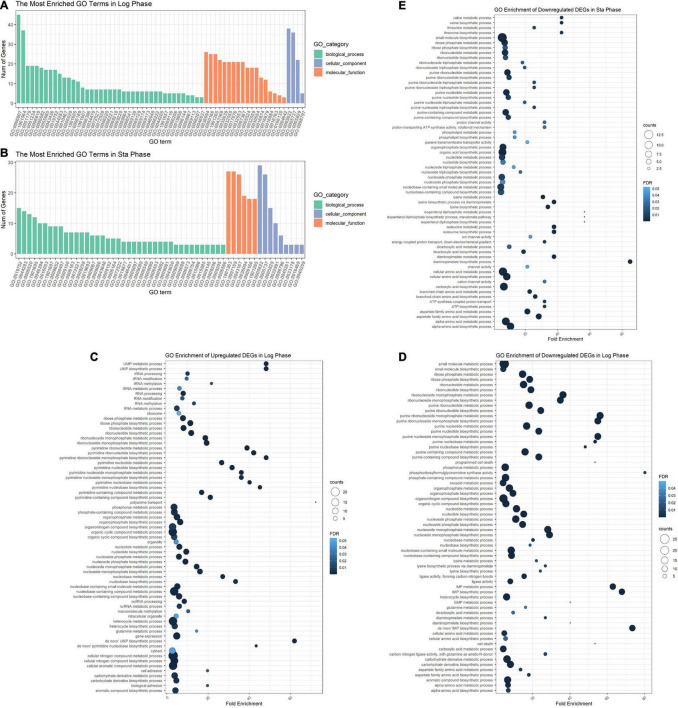
FIGURE 7.
GO enrichment analysis of DEGs. GO analysis divided DEGs of the logarithmic phase (A) and stationary phase (B) into three functional groups: biological processes, molecular function, and cellular component. GO enrichment significance items of upregulated (C) and downregulated genes (D) during the logarithmic phase, and downregulated genes during the stationary phase (E). DEGs, differentially expressed genes; GO, gene ontology.

