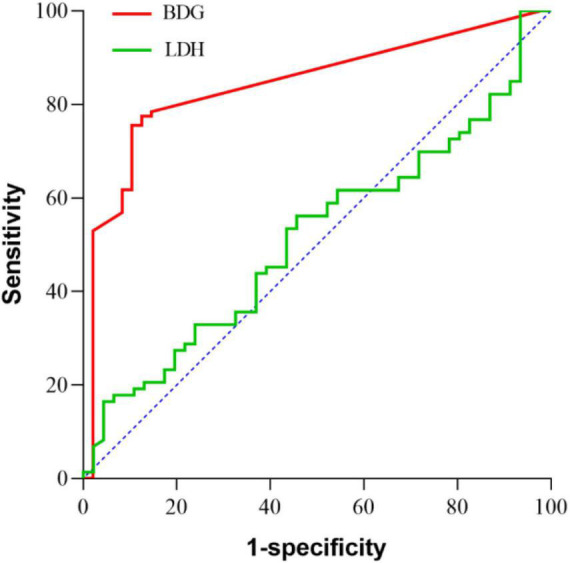
FIGURE 3.

ROC curves for lactate dehydrogenase (LDH), β-D-glucan (BDG). The areas under the curve values are 0.845 (95% CI, 77.8–91.2%, p < 0.001) for BDG and 0.482 (95% CI, 37.6–58.8%, p = 0.744) for LDH. There were significantly differences in the area under the curve value between BDG and LDH (p< 0.001).
