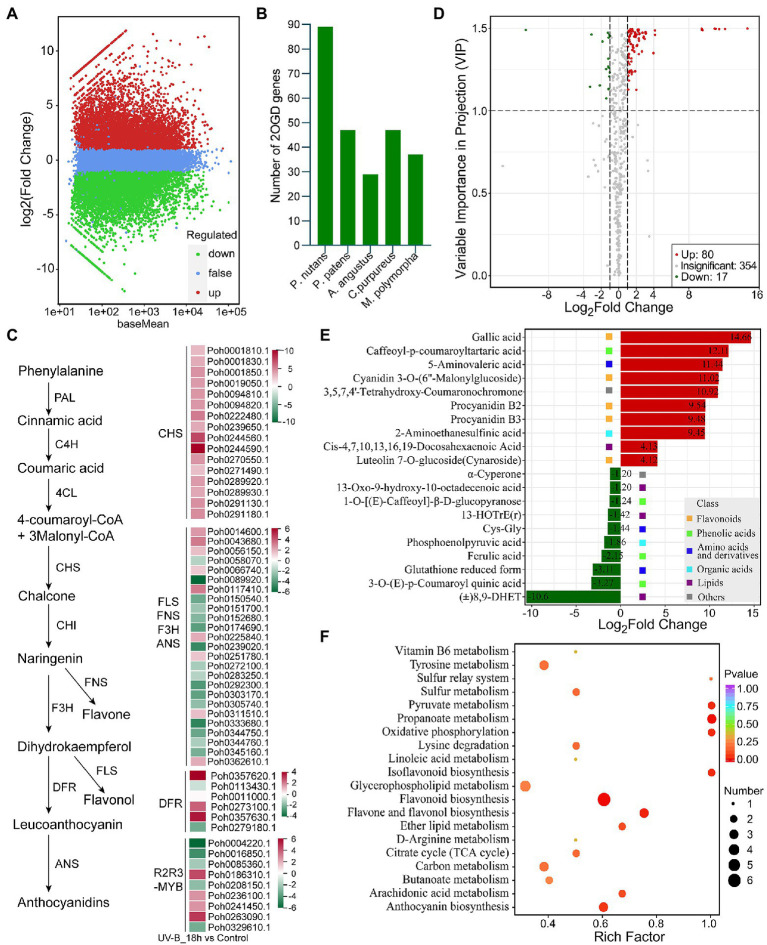
Figure 5.
Integrated multi-omic analyses reveal the role of flavonoid pathway under UV-B light. (A) The volcano plot showing the DEGs between UV-B radiation group and control group. The Y-axis indicates fold change of gene expression (threshold, |log2(Treat/Control)| > 1), while the X-axis means the statistically significant level (threshold, q-value < 0.05). (B) The gene family of 2-oxoglutarate-dependent dioxygenase (2-OGD) was expanded in the Pohlia nutans genome. (C) Flavonoid biosynthesis pathway genes were markedly upregulated under UV-B radiation detected by transcriptome sequencing. (D) The volcano plot showing the contents of metabolites and the statistical significance. Each point represents a metabolite. Horizontal ordinate indicates the fold change of metabolites between two groups, while VIP value represents significant difference in statistical analysis. (E) The fold change of the top 20 significantly changed metabolites (SCMs) between two groups. (F) Statistics of KEGG enrichment for the SCMs.

