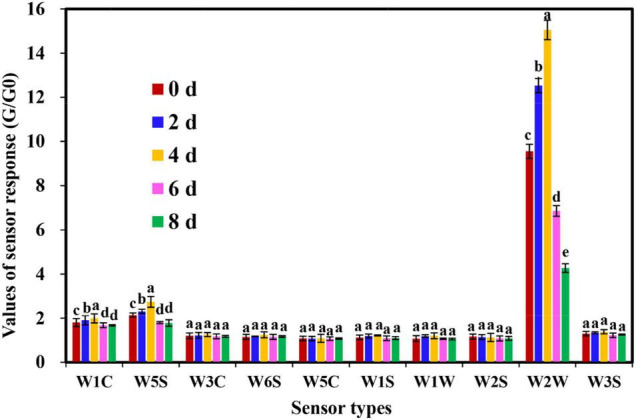
FIGURE 2.

Response values of electronic nose (E-nose) sensors for cut lily flowers during the postharvest process. The values (means ± SE) are the averages of three independent experiments (n = 5). Bars not sharing the same letters on the same sensors indicate statistically significant differences using the Duncan’s multiple range test (P < 0.05).
