FIGURE 7.

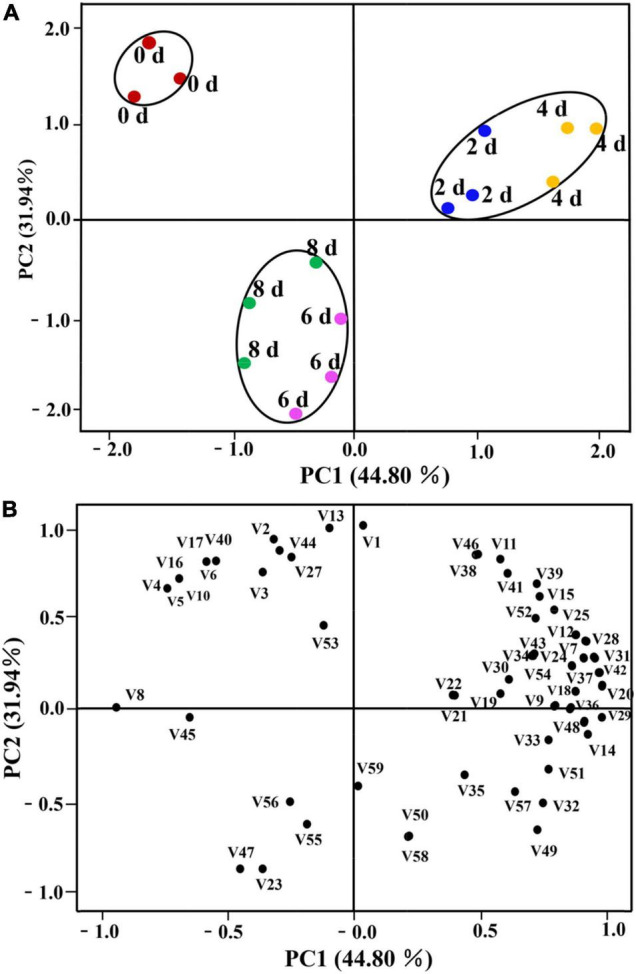
Principal component analysis of cut lilies in different days after harvest and 59 volatile compounds. (A) Score plot; (B) loading plot. The number code after “V” in (7B) also corresponds to the volatile code in Table 1.

Principal component analysis of cut lilies in different days after harvest and 59 volatile compounds. (A) Score plot; (B) loading plot. The number code after “V” in (7B) also corresponds to the volatile code in Table 1.