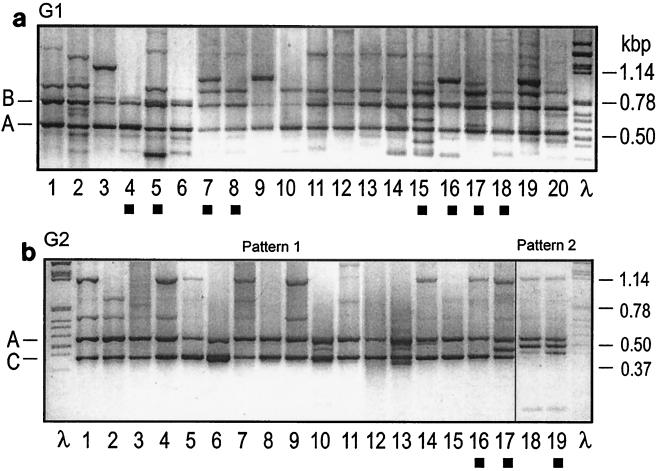
FIG. 1.
Examples of RAPD profiles of G1 and G2 isolates obtained with primer 257. Amplicon A is species specific, amplicon B is specific for G1 isolates, and amplicon C is specific for the majority of G2 isolates. (a) G1 strains. Lane 1, 417; lane 2, 343; lane 3, 374; lane 4, Dla; lane 5, 37-1; lane 6, 134; lane 7, Bay10; lane 8, T5; lane 9, 383; lane 10, 254; lane 11, 478; lane 12, Pepty 695/S; lane 13, 192; lane 14, 150; lane 15, W3; lane 16, W8; lane 17, W10; lane 18, W15; lane 19, 363; lane 20, 317. (b) G2 strains. Lane 1, 231; lane 2, 163; lane 3, 419; lane 4, 420; lane 5, 379; lane 6, 299; lane 7, 413; lane 8, 407; lane 9, 410; lane 10, 421; lane 11, 256; lane 12, 415; lane 13, 386; lane 14, 211; lane 15, 213; lane 16, W9; lane 17, W12; lane 18, 236; lane 19, T8. The solid squares indicate isolates from the study of Jungehülsing and Tudzynski (10).

