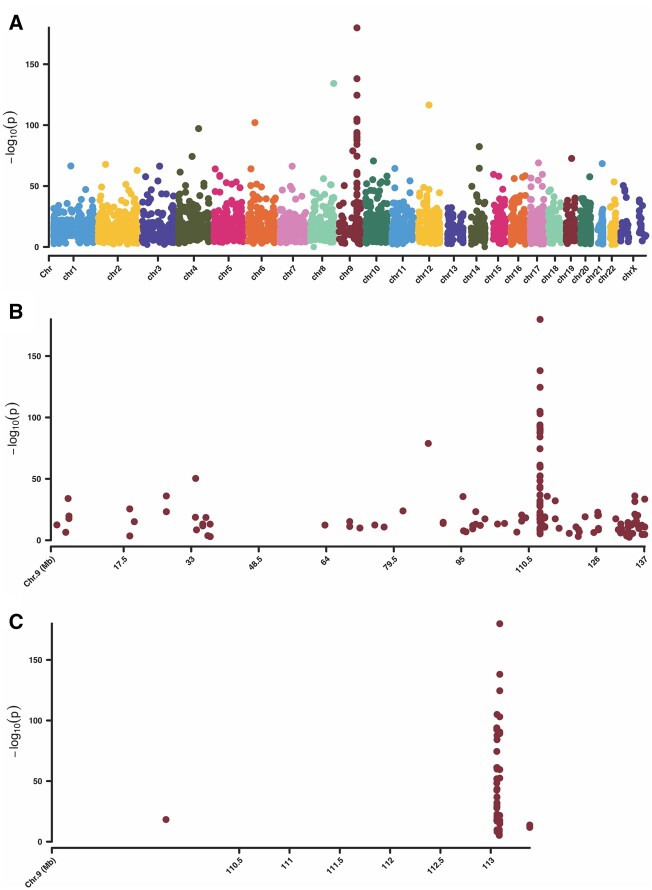
Figure 2.
Manhattan plots of the genome-wide differentially methylated sites (DMS) found in the case versus control group. All sites on these plots are significant. Significance is defined as percent methylation difference >25% and an adjusted P-value (q-value) <0.01. The y-axis represents the −log10(adjusted P). (A) Manhattan plot of all autosomes and the X chromosome. (B) Manhattan plot of only chromosome 9, depicting the ‘hotspot’ region on the distal q arm. (C) Manhattan plot of only the chromosome 9 ‘hotspot’ region ranging from chr9:113059999-113089725.

