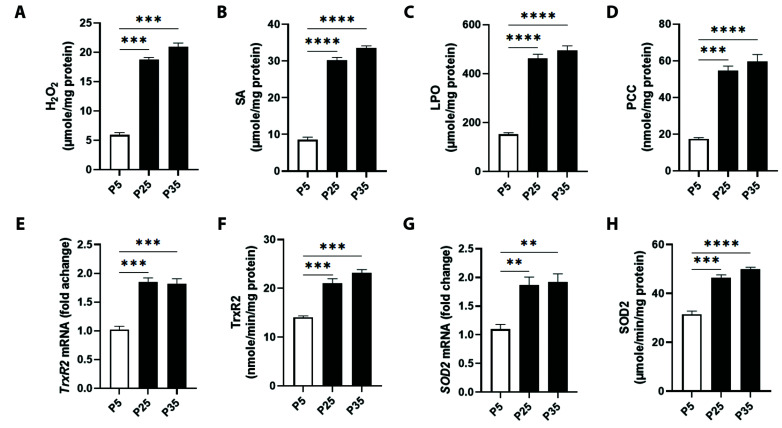
Fig. 4. Mitochondrial oxidative stress markers in primary P5 and senescent P25 and P35 fibroblasts.
Generation levels of (A) hydrogen peroxide (H2O2), (B) superoxide anions (SA), (C) lipid peroxides (LPO), and (D) protein carbonyl content (PCC), and transcriptional and enzyme activities of thioredoxin reductase 2 (TrxR2) (E, F) and superoxide dismutase 2 (SOD2) (G, H) in young (P5) and senescent (P25 and P35) confluent cells. **p < 0.01), ***p < 0.001, and ****p < 0.0001 indicate significant difference from control P5 values (n = 6).

