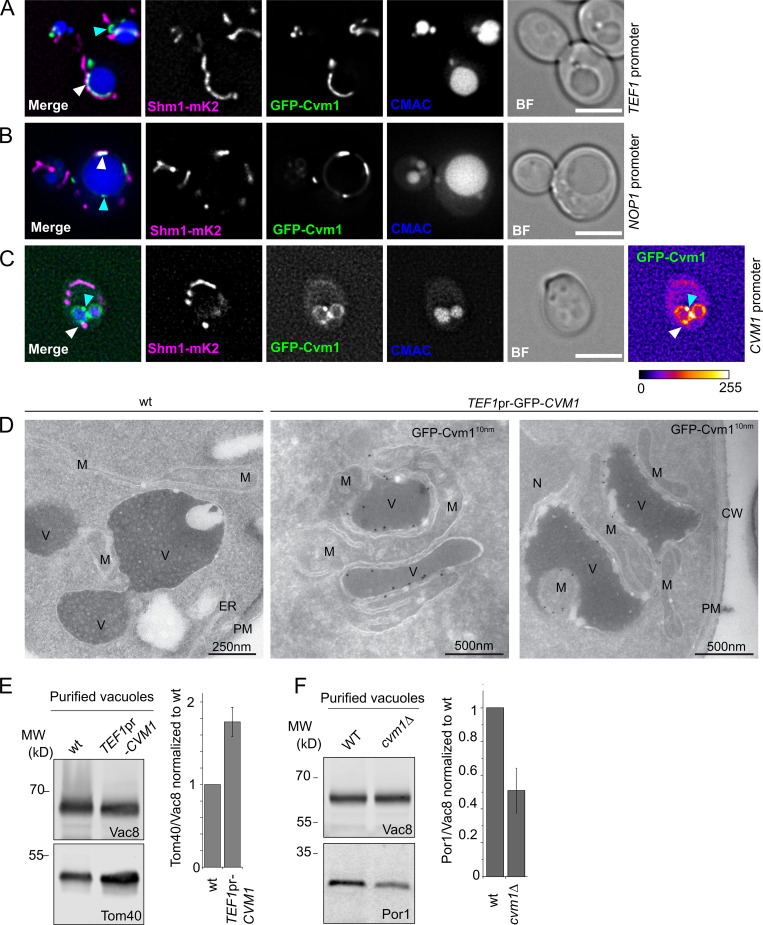
Figure 2.
Cvm1 is a vCLAMP-resident protein and acts as a tether of the contact site. (A and B) Fluorescence microscopy analysis of the localization of GFP-Cvm1 under the control of the TEF1 promoter (A) or NOP1 promoter (B), Shm1-mKate2 as a mitochondrial marker, and CMAC staining as a vacuolar marker. The GFP-Cvm1 signal is observed as accumulations in the regions where the mitochondrial network is apposed to the vacuole (white arrowheads). Additionally, some accumulations are observed which are away from the mitochondria, but always localize to the vacuolar rim (cyan arrowheads). Scale bar represents 5 µm. BF = Brightfield. (C) Fluorescence microscopy analysis of the localization of GFP-Cvm1 under the control of the endogenous CVM1 promoter in the endogenous chromosomal locus, Shm1-mKate2 as a mitochondrial marker, and CMAC staining as a vacuolar marker. The GFP-Cvm1 image is also shown with a fire look-up table (depicted below the image) to allow easier identification of accumulations. The GFP-Cvm1 signal is more homogeneous under the endogenous promoter than when Cvm1 is overexpressed. Strong accumulations can be observed, which occur away from the mitochondrial network (cyan arrowhead). Additionally, in regions of apposition of the mitochondrial network and the vacuole, some milder accumulations can be observed (white arrowhead). Scale bar represents 5 µm. (D) Ultrathin cryosections obtained from WT and overexpressed GFP-Cvm1 (TEF1 promoter) were immunogold-labeled for GFP. The presence of GFP-Cvm1 was detected at the interfaces between the vacuole (V) and the mitochondria (M), which were also extended in this strain. CW = cell wall; PM = plasma membrane. (E and F) Analysis of mitochondrial copurification in vacuole preparations. Vacuoles were purified from a WT and a deletion of CVM1 (E) and overexpression of CVM1 (F) under the control of the TEF1 promoter. Copurification of mitochondria was assessed from the levels of Por1 or Tom40 (mitochondrial markers) and Vac8 (vacuolar marker) in the purified vacuole fraction by Western blot. The bar graphs show mean ± SD of the ratio of Por1 or Tom40 to Vac8 in the vacuole fraction normalized to the ratio for the WT sample in each experiment (E, n = 3; F, n = 4). Source data are available for this figure: SourceData F2.

