Figure 3.
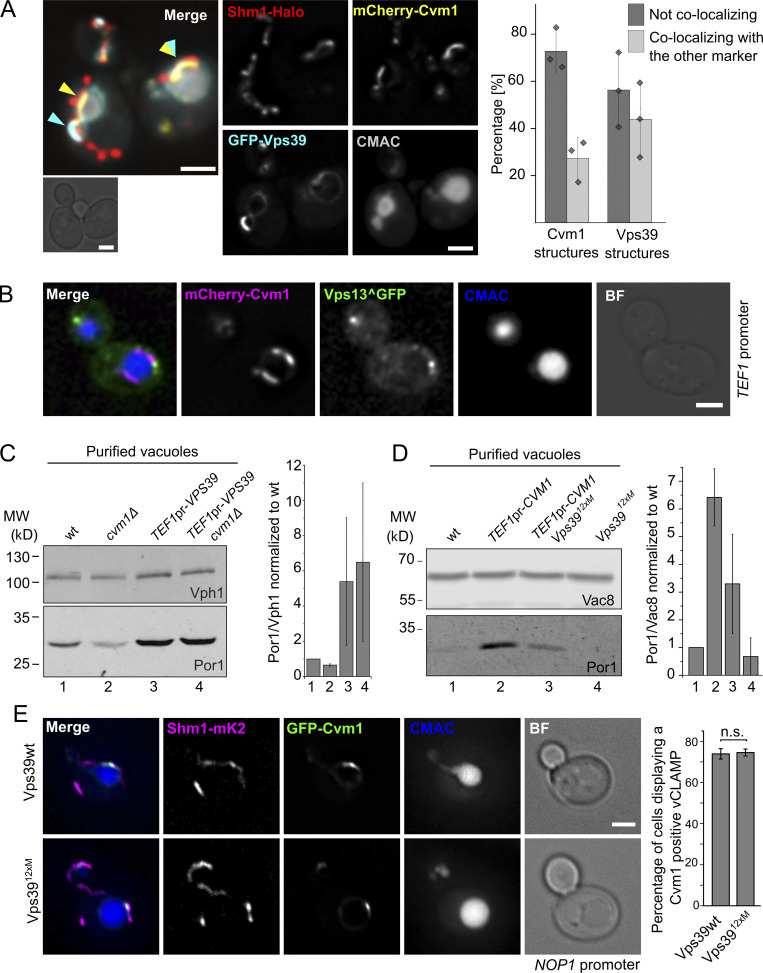
Relationship of Cvm1 with other vCLAMP components. (A) Vps39 and Cvm1 stain mostly distinct areas of the vCLAMP contact site. Representative images and quantification of a fluorescence microscopy analysis of the localization of mCherry-Cvm1 and GFP-Vps39, both under the control of the TEF1 promoter, Shm1-Halo stained with JF646 as a mitochondrial marker, and CMAC staining as a vacuolar marker. Both the signal of Vps39 and Cvm1 accumulate in the vacuole–mitochondria interface, but they mostly exclude each other (cyan and yellow arrowheads). However, some regions show double labeling (overlapping cyan and yellow arrowheads). All scale bars represent 2 µm. The bar graph shows the percentage of Vps39 or Cvm1 structures that colocalize or not with the other marker; bars are mean from three independent experiments, shown as individual dots. Error bars represent SD. (B) Cvm1 and Vps13 do not colocalize. Fluorescence microscopy analysis of the localization of mCherry-Cvm1 under the control of the TEF1 promoter, Vps13 internally tagged with GFP, and CMAC staining as a vacuolar marker. No colocalization was observed between the signals of Vps13 and Cvm1. Scale bar represents 2 µm. BF = Brightfield. (C) Analysis of the dependence of Vps39 on Cvm1 to generate extended vCLAMPs. The mitochondrial copurification in vacuole preparations was analyzed. Vacuoles were purified from the indicated strains, and the copurification of mitochondria was assessed from the levels of Por1 (mitochondrial marker) and Vph1 (vacuolar marker) in the purified vacuole fraction by Western blot. The bar graph shows mean ± SD of the ratio of Por1/Vph1 in the vacuole fraction normalized to the ratio for the WT sample in each experiment (n = 2). (D) Analysis of the dependence of Cvm1 on Vps39 to generate extended vCLAMPs. The mitochondrial copurification in vacuole preparations was analyzed. Vacuoles were purified from the indicated strains, and the copurification of mitochondria was assessed from the levels of Por1 (mitochondrial marker) and Vac8 (vacuolar marker) in the purified vacuole fraction by Western blot. The bar graph shows mean ± SD of the ratio of Por1/Vac8 in the vacuole fraction normalized to the ratio for the WT sample in each experiment (n = 4). (E) Cvm1-mediated vCLAMPs are still formed when Vps39 vCLAMPs are impaired. Fluorescence microscopy analysis of a strain expressing GFP-Cvm1 under the control of the NOP1 promoter, Shm1-mKate2 as a mitochondrial marker, and labeled with CMAC as a vacuole lumen marker. Cvm1 forms accumulations in the interface between the vacuole and the mitochondria in the presence of both the WT Vps39 allele and the Vps3912xM allele, which is impaired for vCLAMP formation. Scale bar represents 2 µm. The bar graph displays mean ± SD of the percentage of cells showing Cvm1-positive vCLAMPs in both strains. Source data are available for this figure: SourceData F3.

