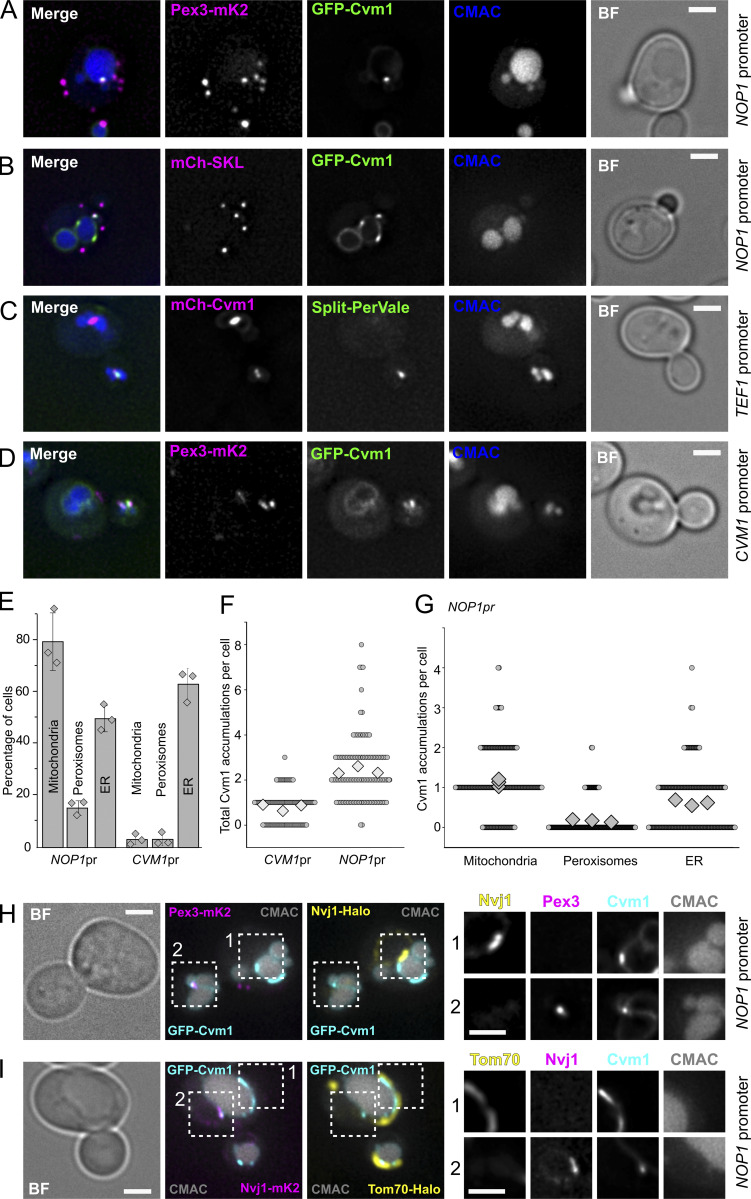
Figure 5.
Cvm1 localizes at the peroxisome–vacuole contact site. (A and B) Fluorescence microscopy analysis of the localization of GFP-Cvm1 under the control of the NOP1 promoter, Pex3-mKate2, or mCherry-SKL as peroxisomal markers, and CMAC staining as a vacuolar marker. Accumulations of GFP-Cvm1 signal can be observed on peroxisomes that are apposed to the vacuole. No signal of GFP-Cvm1 was observed on peroxisomes away from the vacuole. Additionally, GFP-Cvm1 signal can be observed on other areas of the vacuole. Scale bar represents 2 µm. BF = Brightfield. (C) Fluorescence microscopy analysis of a split-PerVale reporter strain with mCherry-Cvm1 expressed under the control of the TEF1 promoter and CMAC as a vacuolar staining. The split-PerVale reporter contains the VC fragment fused to the vacuolar protein Zrc1 and the VN fragment fused to the peroxisomal protein Pex25. Accumulations of Cvm1 sometimes colocalize with the signal of the split-PerVale reporter. Scale bar represents 2 µm. (D) Fluorescence microscopy analysis of the localization of GFP-Cvm1 under the control of the endogenous promoter, Pex3-mKate2 as a peroxisomal marker, and CMAC staining as a vacuolar marker. GFP-Cvm1 signal can be observed on the vacuolar membrane. Rarely, accumulations are observed next to peroxisomes that are apposed to the vacuole (see quantification in E). Scale bar represents 2 µm. (E) Quantification of the percentage of cells in which accumulations of Cvm1 are observed next to mitochondria, peroxisomes, or the nuclear ER, when Cvm1 is expressed under the control of either the NOP1 promoter or the endogenous CVM1 promoter. Bars represent average ± SD of three independent experiments, shown as individual dots. For each experiment, ≥50 cells were counted per condition. (F) Plot showing the number of accumulations of Cvm1 on the vacuole membrane per cell (circles), when Cvm1 is expressed under the control of the CVM1 promoter or the NOP1 promoter. The average for each of three independent experiments is shown as a diamond; ≥40 cells were counted per experiment and condition. (G) Plot showing the number of Cvm1 accumulations per cell (circles) in proximity of either mitochondria, peroxisomes, or the nuclear ER, when Cvm1 is expressed under the control of the NOP1 promoter. The average for each of three independent experiment is shown as a diamond; ≥70 cells were counted per experiment and condition. (H) Fluorescence microscopy analysis of a GFP-Cvm1 under the control of the NOP1 promoter with Pex3-mKate2 as a peroxisomal marker, Nvj1-Halo labeled with JF646, and CMAC as a vacuolar staining. 9 ± 8% of the structures containing GFP-Cvm1 and Pex3-mKate2 were found in the proximity of Nvj1-Halo (n = 3 independent experiments). Scale bars represent 2 µm. (I) Fluorescence microscopy analysis of a GFP-Cvm1 under the control of the NOP1 promoter with Nvj1-mKate2, Tom70-Halo labeled with JF646 as a mitochondrial marker, and CMAC as a vacuolar staining. 10 ± 4% of the structures containing GFP-Cvm1 and Tom70-Halo were found in the proximity of Nvj1-mKate2 (n = 3 independent experiments). Scale bars represent 2 µm.

