Figure 8.
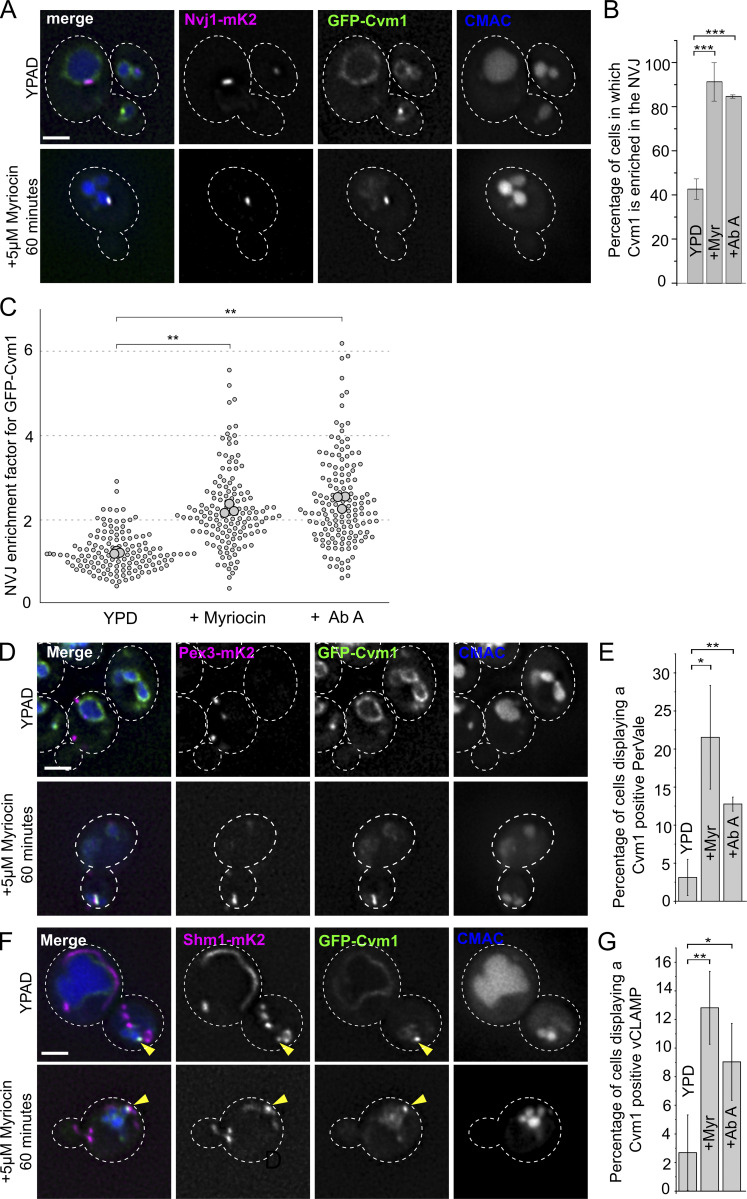
Cvm1-mediated contacts are induced by a decrease in complex sphingolipid levels. (A) Cvm1 accumulates at the NVJ upon depletion of sphingolipids. Fluorescence microscopy analysis of the localization of GFP-Cvm1 under the control of the endogenous promoter, Nvj1-mKate2 as a NVJ marker, and CMAC staining as a vacuolar marker. Cells were grown in rich media (YPAD) and incubated with 5 μM myriocin for 60 min where indicated. Under normal growth conditions, Cvm1 accumulates at the NVJ in some cells. After incubation with myriocin, the accumulations of Cvm1 at the NVJ become more pronounced and happen in a higher number of cells. Scale bar represents 2 μm. Dotted lines mark cell outlines. (B) Quantification of the effect of myriocin and AbA on the localization of GFP-Cvm1 to the NVJ; representative images are shown in A and Fig. S5 A. Cells were grown in YPD and incubated with 5 μM myriocin for 60 min or 250 nM AbA for 30 min before imaging. The percentage of cells in which Cvm1 was enriched at the NVJ was quantified for each growth condition. The bars represent the mean ± SD for three independent measurements. (C) Quantification of enrichment of GFP-Cvm1 at the NVJ upon treatment with myriocin and AbA. For each cell, an NVJ enrichment factor was calculated as the mean intensity value of GFP-Cvm1 along a line profile within the NVJ, divided by the mean intensity value in a line profile along the rest of the vacuolar membrane. Each dot represents one cell, and the bigger circles represent the mean for each of three independent experiments. For each experiment and condition, at least 40 cells were analyzed. (D) Cvm1 accumulates more frequently at PerVale upon decreasing sphingolipid levels. Fluorescence microscopy analysis of the localization of GFP-Cvm1 under the control of the endogenous promoter, Pex3-mKate2 as a peroxisomal marker, and CMAC staining as a vacuolar marker. Cells were grown in YPAD and incubated with 5 μM myriocin for 60 min where indicated. Scale bar represents 2 μm. (E) Quantification of the effect of myriocin and AbA on the distribution of GFP-Cvm1. Cells were grown in YPAD and incubated with 5 μM myriocin for 60 min or 250 nM AbA for 30 min before imaging (related to D and Fig. S5 B). A Cvm1-positive PerVale was considered as an accumulation of GFP-Cvm1 fluorescence in the place where a peroxisome (labeled with Pex3-mKate2) was apposed to the vacuole (labeled with CMAC). A percentage was determined for each experiment, and the bars represent the mean of the three experiments; 50 cells were quantified per condition and experiment. (F) Cvm1 accumulations at the vCLAMP are more frequent upon decreasing sphingolipid levels. Fluorescence microscopy analysis of the localization of GFP-Cvm1 under the control of the endogenous promoter, Shm1-mKate2 as a mitochondrial marker, and CMAC staining as a vacuolar marker. Cells were grown in YPD and incubated with 5 μM myriocin for 60 min where indicated. Scale bar represents 2 μm. (G) Quantification of effect of myriocin and AbA on the distribution of GFP-Cvm1. Cells were grown in YPD and incubated with 5 μM myriocin for 60 min or 250 nM AbA for 30 min before imaging (related to F and Fig. S5 C). A Cvm1-positive vCLAMP was considered as an accumulation of GFP-Cvm1 fluorescence in the place where the mitochondria (labeled with Shm1-mKate2) was apposed to the vacuole (labeled with CMAC). A percentage was determined for each experiment, and the bars represent the mean of the three experiments; error bars represent SD; 50 cells were quantified per condition and experiment. *, P < 0.05; **, P < 0.01; ***, P < 0.001.

