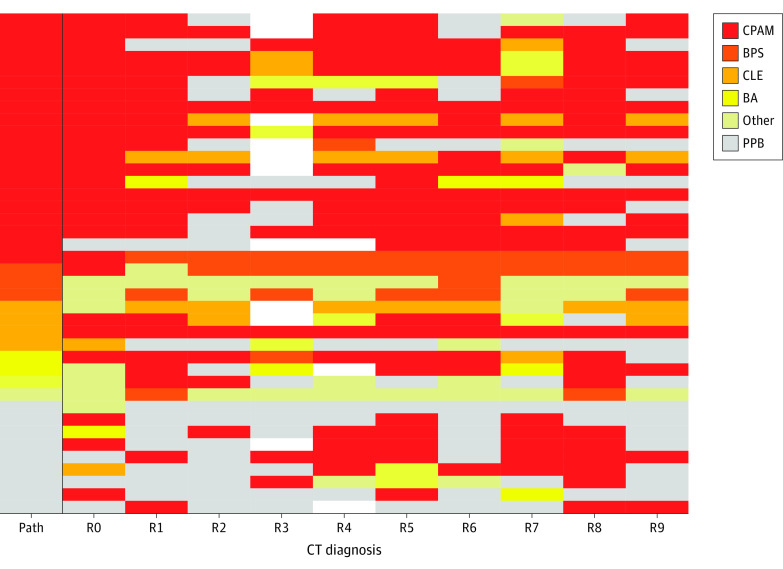
Figure 1. Heatmap Illustrating the Variability in Computed Tomography (CT) Diagnosis Among 40 Lung Lesions.
The correct diagnosis (pathology) is indicated in the far-left column. Nonevaluable studies are shown in white. BA indicates bronchial atresia; BPS, bronchopulmonary sequestration; CLE, congenital lobar emphysema; CPAM, congenital pulmonary airway malformation; Path, pathology; PPB, pleuropulmonary blastoma; R0, original interpretation; and R1-R9, study interpretation by 1 of 9 radiologists.

