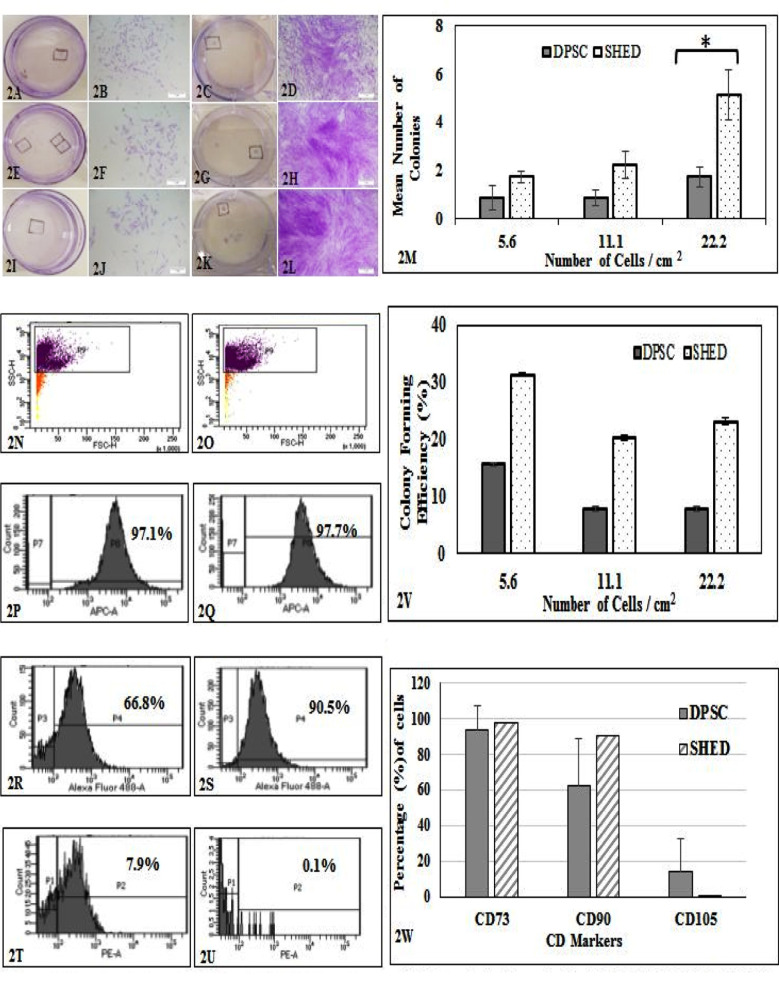
Fig.2.
Colony forming Assay for DPSC and SHED. All 35mm plate showed colonies stained with crystal violet. (2A & 2C), (2E % 2G) & (2I & 2K) represent 5.6, 11.1, 22.2 cells / cm2 respectively. Representative colonies were marked in all plates and were imaged. Micrographs; (2B & 2D), (2F & 2H) and (2J & 2L) represent 5.6, 11.1 and 22.2 cells / cm2 respectively. Scale bar = 5μm. Graph (2M) compares number of colonies: ± showed significance at p<0.05, (2V) colony forming efficiency (%) between DPSC and SHED at plating cell densities of 5.6, 11.1 and 22.2 cells /cm2. Error bars represent SEM. Representative immunophenotypes of DPSC (left panel) & SHED (right panel). Histograms show presence of classical stem cell markers; (2N & 2O) show gated cells (horizontal box), (2P & 2Q) represent APC-CD73, (2R & 2S) represent FITC-CD90 and (2T & 2U) represent PE-CD105. (2W) Comparing percentage expression of classical stem cell markers..

