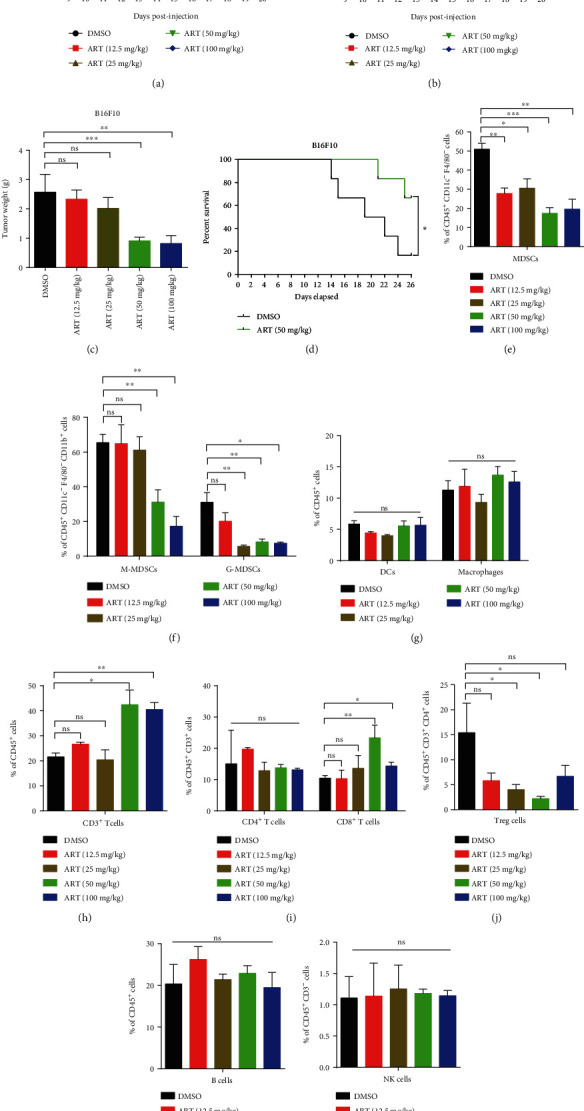
Figure 4.

Targeting MDSCs by ART reduces tumor growth in two mouse tumor models. (a–c) C57BL/6 mice injected s.c. on day 0 with B16F10 melanoma cells and received subsequent i.p. injections of either DMSO or different doses of ART (12.5, 25, 50, and 100 mg/kg) once every day starting from day 9 of B16F10 tumor model. (a) Tumor growth curve, (b) mice weight curve, and (c) tumor weight recorded from B16F10 tumor-bearing mice (n = 5 mice per group). (d) Survival curve of DMSO and ART 50 mg/kg-treated B16F10 tumor-bearing mice (n = 5 mice per group). (e–l) The proportions of immune cells in tumor tissues: MDSCs, M-MDSCs, G-MDSCs, DCs, macrophages, CD3+ T cells, CD4+ T cells, CD8+ T cells, Treg cells, B cells, and NK cells were detected by flow cytometry. MDSCs were CD45+CD11c−F4/80−CD11b+Gr-1+ cells; M-MDSCs were CD45+CD11c−F4/80−CD11b+Ly6G−Ly6Chigh cells; G-MDSCs were CD45+ -CD11c−F4/80−CD11b+Ly6G+Ly6Clow/int cells; DCs were CD45+F4/80−CD11c+ cells; macrophages were CD45+CD11c−F4/80+ cells; CD3+ T cells were CD45+CD3+ cells; CD4+ T cells were CD45+CD3+CD4+CD8− cells; CD8+ T cells were CD45+CD3+CD4−CD8+ cells; Treg cells were CD45+CD3+CD4+CD25+Foxp3+ cells; B cells were CD45+CD19+ cells; and NK cells were CD45+CD3−CD4−NK1.1+ cells. Data are means ± SEM and are from a representative experiment of three (a–c and e–l). Unpaired Student's t test for (a)–(c) and (e)–(l). Two-sided log-rank test for (d). ∗P < 0.05, ∗∗P < 0.01, and ∗∗∗P < 0.001. ns: not significant.
