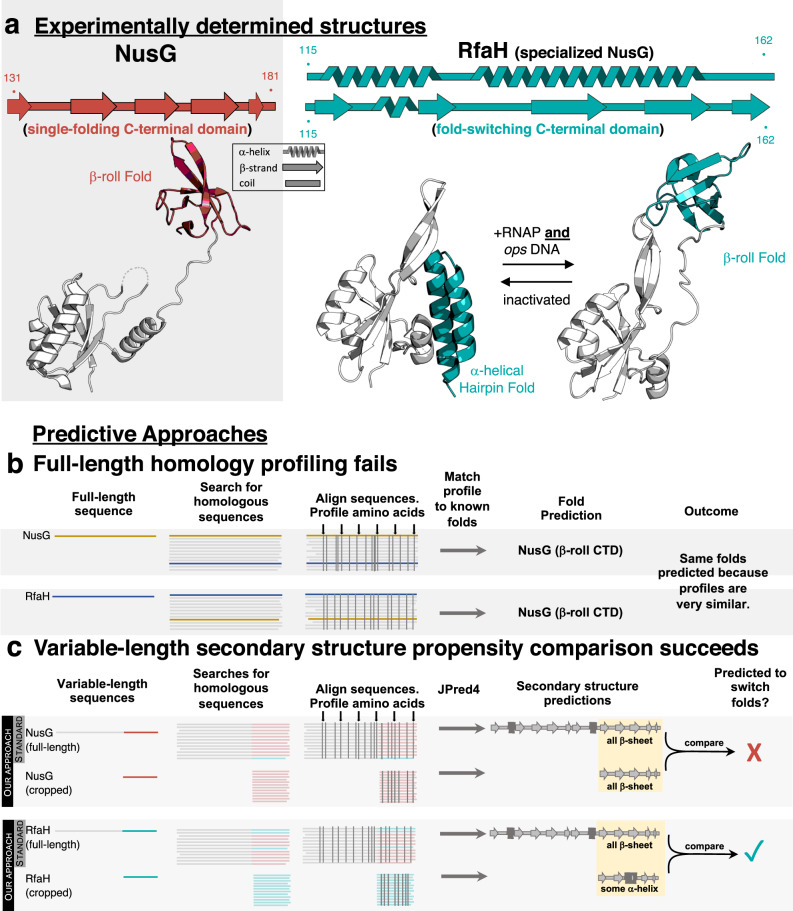
Fig. 1. Variable-length secondary structure propensity comparison discriminates between fold-switching RfaH and single-folding NusG.
a Experimentally determined secondary structures and folds of single-folding NusG (PDB ID: 6ZTJ_CF) and the autoinhibited/active NusGSP, RfaH (α-helical hairpin PDB: 5OND_A/β-roll PDB: 6C6S_D, respectively). Dashed lines represent missing density in the NTD of the NusG cryo-EM structure and in the NTD-CTD linker of the RfaH crystal structure. NusG/RfaH CTDs are colored red/teal; NTDs are gray. b Profile-based methods fail to identify structural differences between full-length NusG and RfaH because both proteins have similar conservation patterns. Vertical gray bars indicate positions of conserved amino acids. c Variable-length secondary structure propensity comparison identifies structural differences between single-folding NusG and fold-switching RfaH. Secondary structure propensities of both the full-length and cropped (CTD) sequences of NusG (above) and RfaH (below) are determined using JPred4. Typically, JPred4 is run on full-length sequences only (“standard” in gray box). While both full-length and cropped NusG sequences have similar amino acid conservation patterns (gray vertical lines, top gray panel), conservation patterns differ for full-length and cropped RfaH (gray vertical lines, bottom gray panel). Similar/different full-length and cropped conservation patterns lead to similar/different secondary structure predictions, suggesting that NusG does not switch folds (top) while RfaH does (bottom). These different patterns likely result from different MSA depths (Fig. S1). Full-length alignments are deeper and have mixtures of both colors, indicating the presence of both fold-switching and single-fold sequences. These mixtures reflect properties of the NusG superfamily. By contrast, cropped sequence MSAs are shallower and homogeneous, reflecting properties of NusG subfamilies. The sequence distributions depicted are for illustrative purposes only since true sequence distributions are unknown. Source data are provided as a Source Data file.

