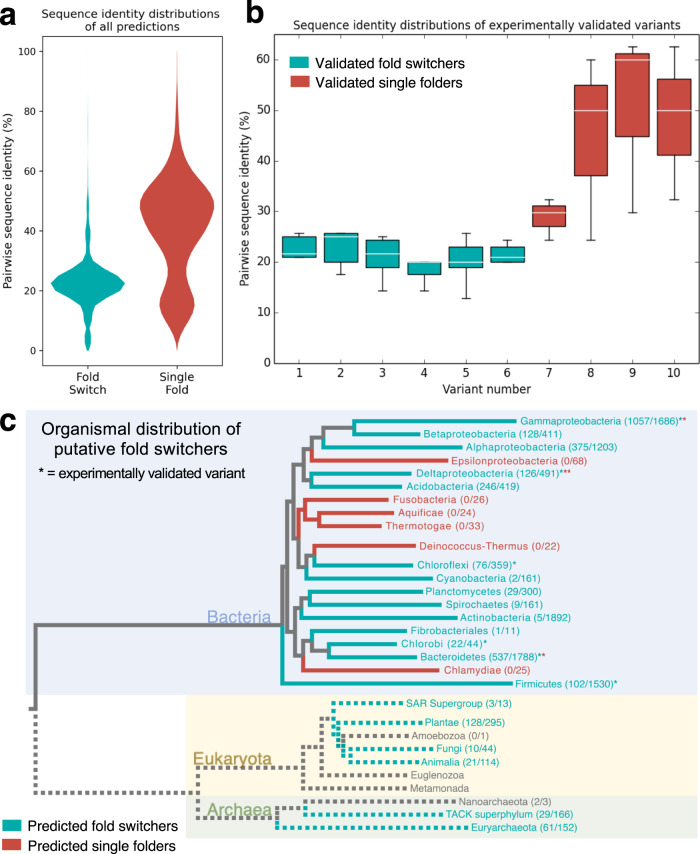
Fig. 4. The sequences of fold-switching CTDs are highly diverse and found in a wide variety of bacterial phyla.
a Violin plots of pairwise sequence identities differ significantly for putative fold switchers and putative single folders. On average, pairwise sequence identities are lower for putative fold switchers (teal, 20.4%) than single folders (red, 40.5%). b Box-and-whiskers plots of pairwise sequence identities of fold-switching and single-folding CTDs of variants 1-10 in Fig. 2. The distributions of each teal (fold-switching)/red (single-fold) box were derived from n = 5/3 independent pairwise identities; each box bounds the interquartile range (IQR) of the data (first quartile, Q1 through third quartile, Q3); medians of each distribution are shown in white; lower whisker is the lowest datum above Q1-1.5*IQR; upper whisker is the highest datum below Q3 + 1.5*IQR. These distributions are consistent with the violin plots in panel (a). c Fold-switching CTDs are predicted in many bacterial phyla (blue background) and other kingdoms of life. Numbers next to taxa represent #predicted fold switchers/#total sequences. Gray branches represent unidentified common ancestors, since the evolution of fold-switching NusGs is unknown. Dotted lines represent lower-confidence predictions since fold switching has not been confirmed experimentally in Archaea (green background) and Eukaryota (yellow background). Fold-switching/single-folding predictions are represented by teal/red colorings; predictions in branches with fewer than 10 sequences are gray. Source data are provided as a Source Data file.

