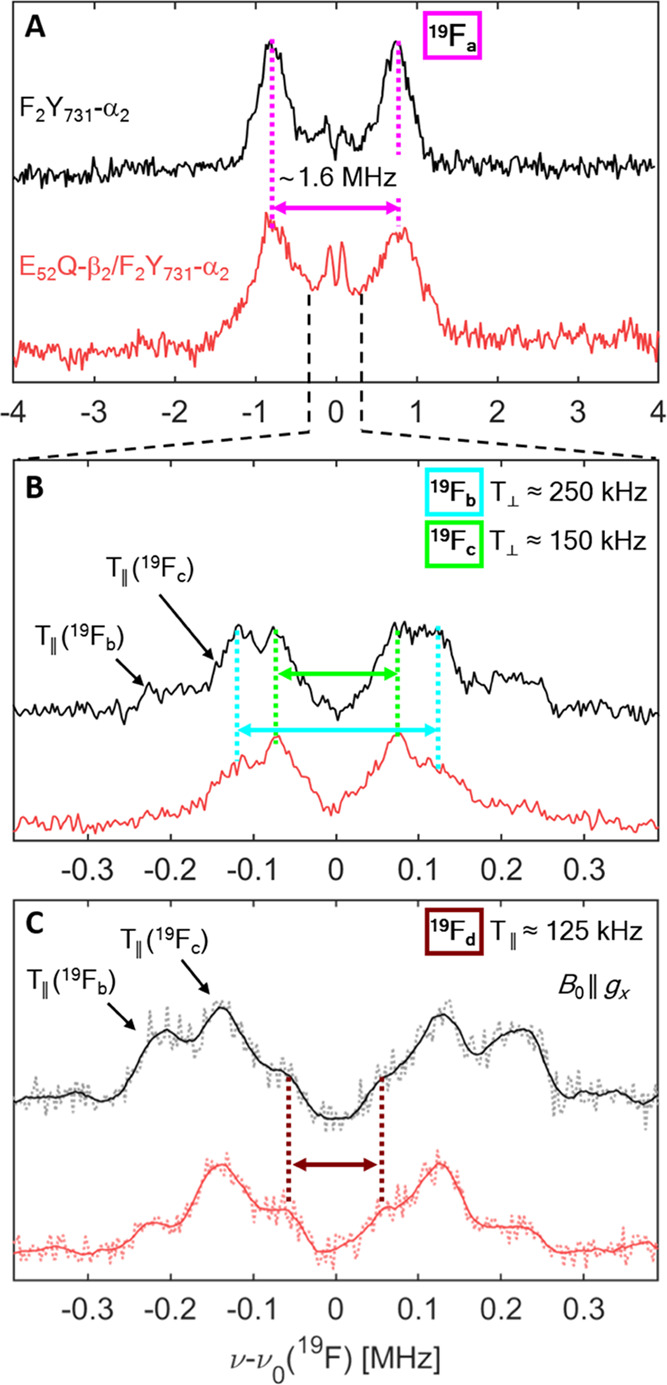
Figure 5.

94 GHz 19F Mims ENDOR spectra of F3Y122-β2/F2Y731-α2 (80 μM, TQ = 50 s, black lines) and E52Q/F3Y122-β2/F2Y731-α2 (80 μM, TQ = 35 s, red lines) at T = 50 K. Spectra in panels (A) and (B) were obtained by adding three orientation-selective spectra. (A) Measurement with short τ values (∼250 ns). (B) Measurement with larger τ values (∼620 ns). (C) Orientation-selective spectra with B0 a∥ gx and τ = 620 ns after data point smoothing with the Savitzky–Golay filter (full lines). Original data are shown as dotted lines. Measurement time per spectrum is 30–40 h (A) and 50–60 h (B). Analysis of the spectra in panels (A)–(C) requires consideration of four nuclei 19Fa–19Fd, as marked by arrows and colored dashed lines.
