
Figure 8.
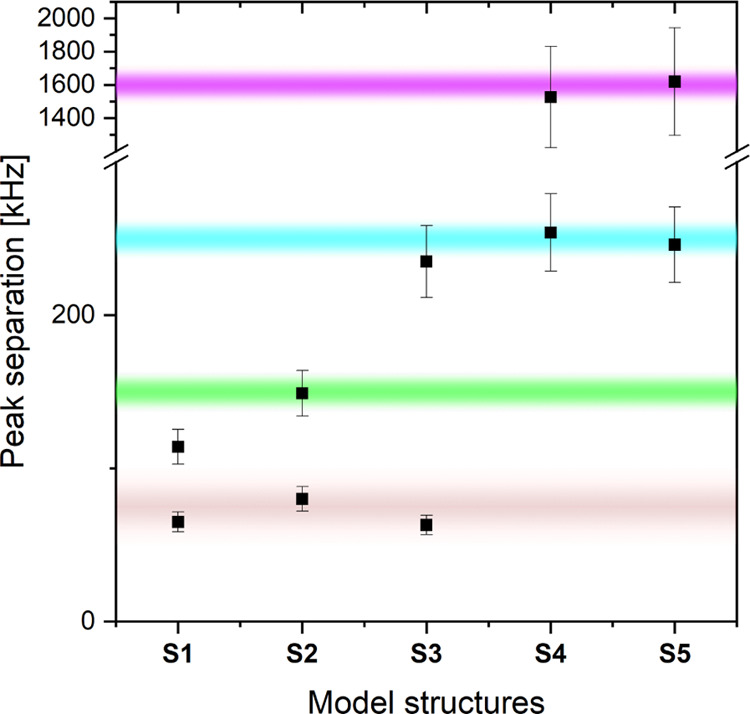
Comparison of experimentally observed peak separation from Figures 5 and 9 (purple (Fa), cyan (Fb), green (Fc), and brown (Fd) shadings indicate the range of uncertainty) with DFT-predicted peak positions (black squares) for models S1–S5. For the DFT values, an error of ±20% (Fa, this nucleus exhibits isotropic and anisotropic coupling) or ±10% (Fb–Fd, these nuclei show purely dipolar coupling) is estimated.