
Figure 4.
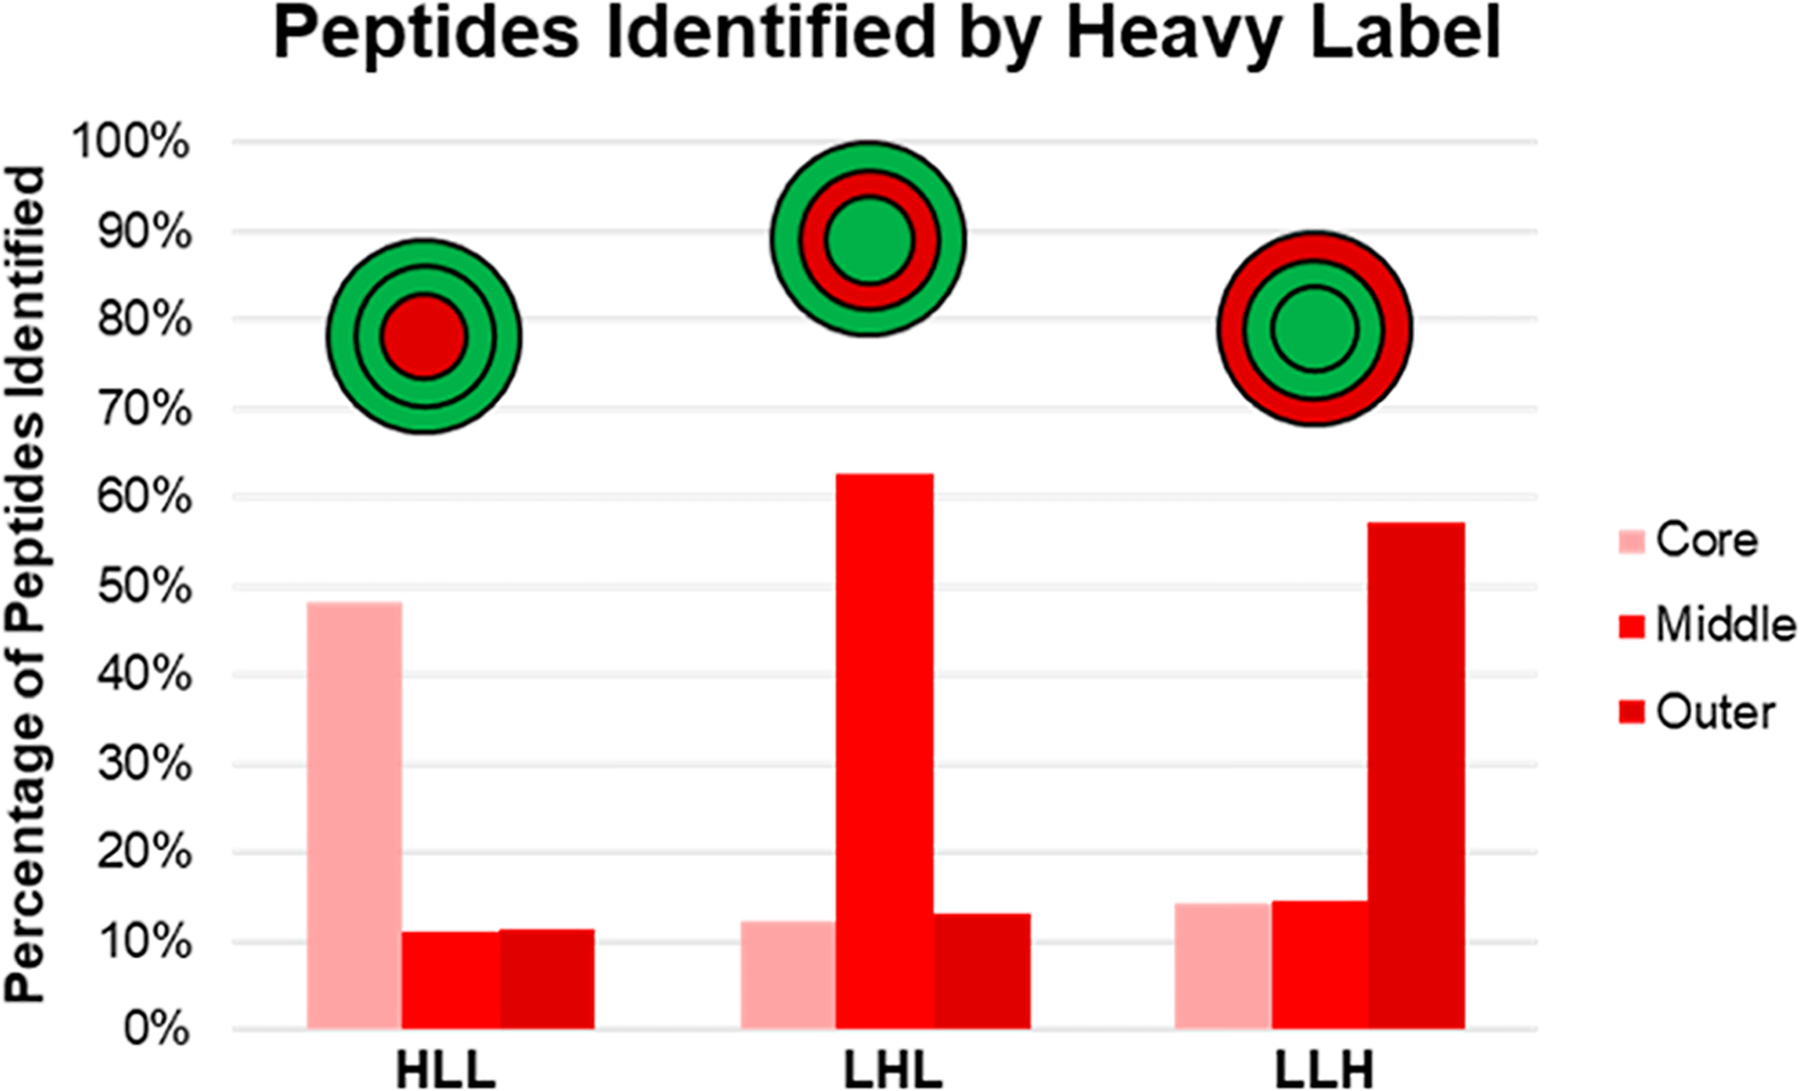
SILAC label incorporation percentages were calculated by counting the number of peptides identified by each label type. The red bars show the percentage of peptides identified by the heavy isotopic label in each layer of the spheroids. The red and green circle diagrams represent the spheroid population being examined, with green referring to light-label presence and red indicating heavy labeling.