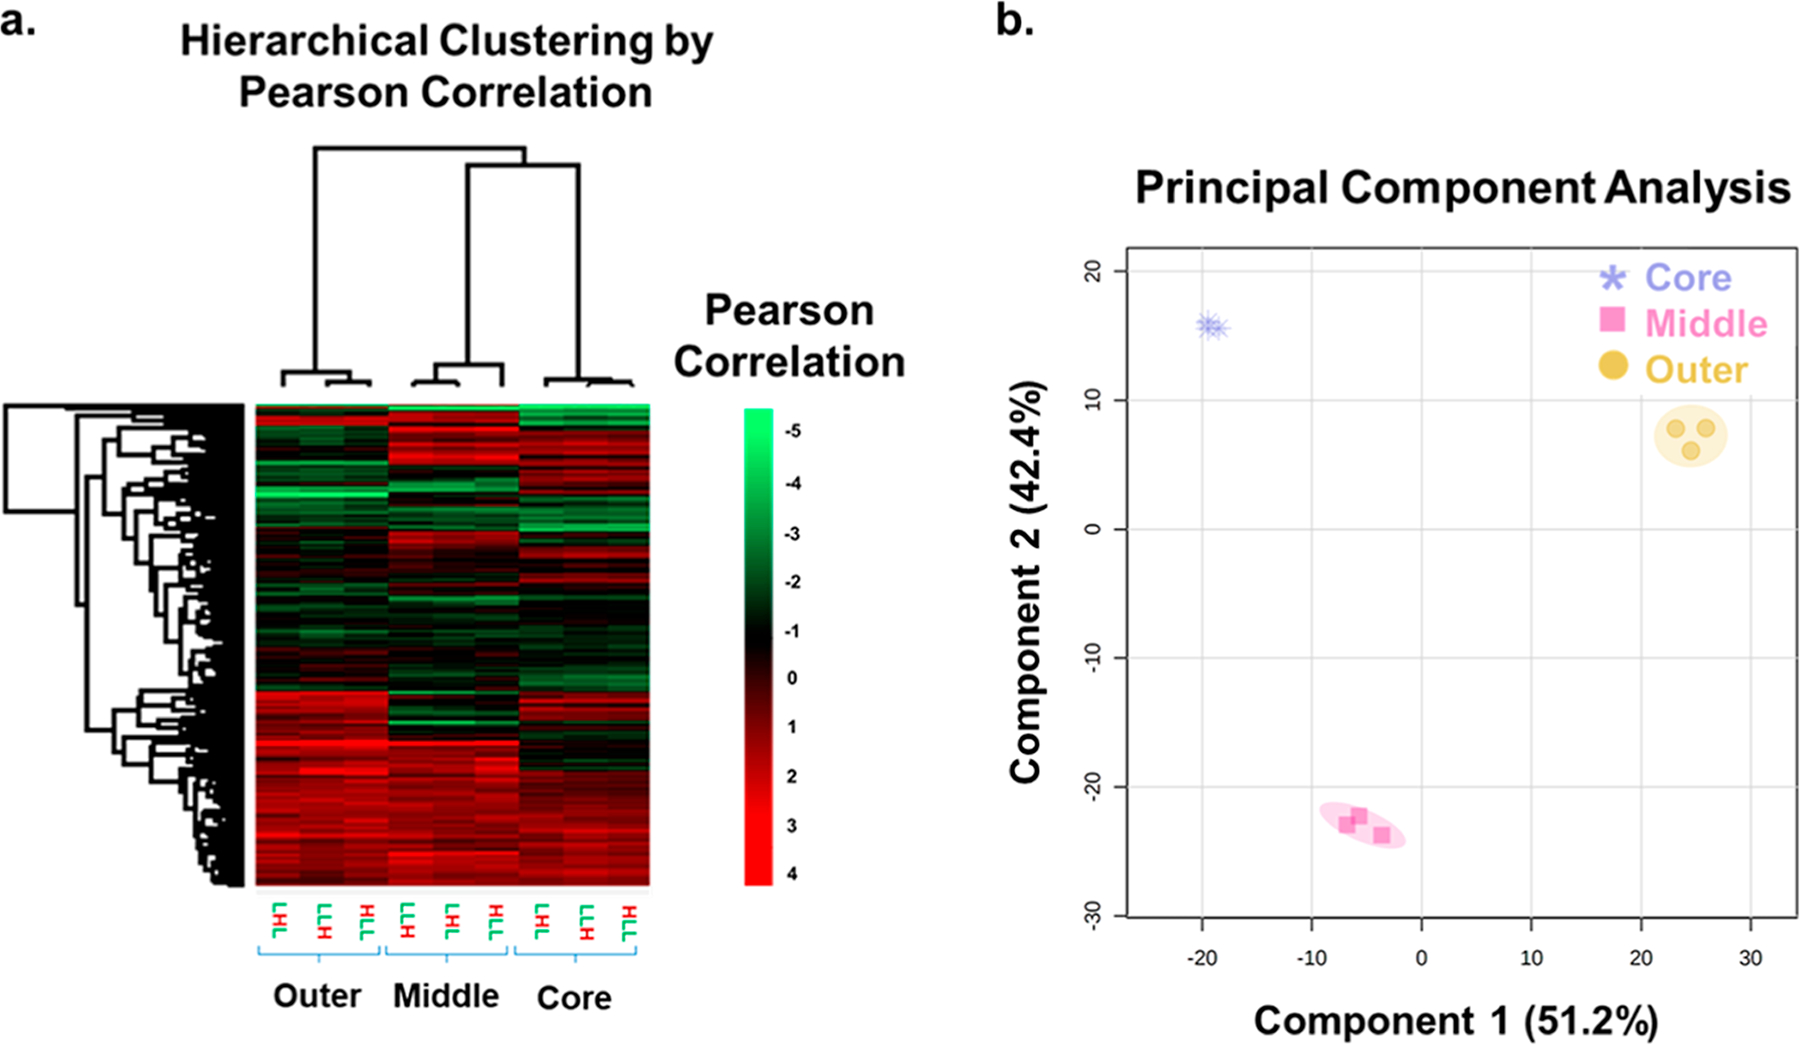
Figure 5.

Hierarchical clustering by Pearson correlation and PCA suggests layer specific separation for the proteins identified by layer. In the hierarchical clustering (a), more abundant proteins are shown in red, with less abundant proteins shown in bright green. PCA (b) of each labeled layer of the spheroid populations. The layers are represented by the shape of the data points and color (purple = core, pink = middle, and yellow = outer). The shading around the data points is representative of the 95% confidence regions. Spatial origin (core, middle, or outer) is the primary determinant of the clustering.
