
Figure 6.
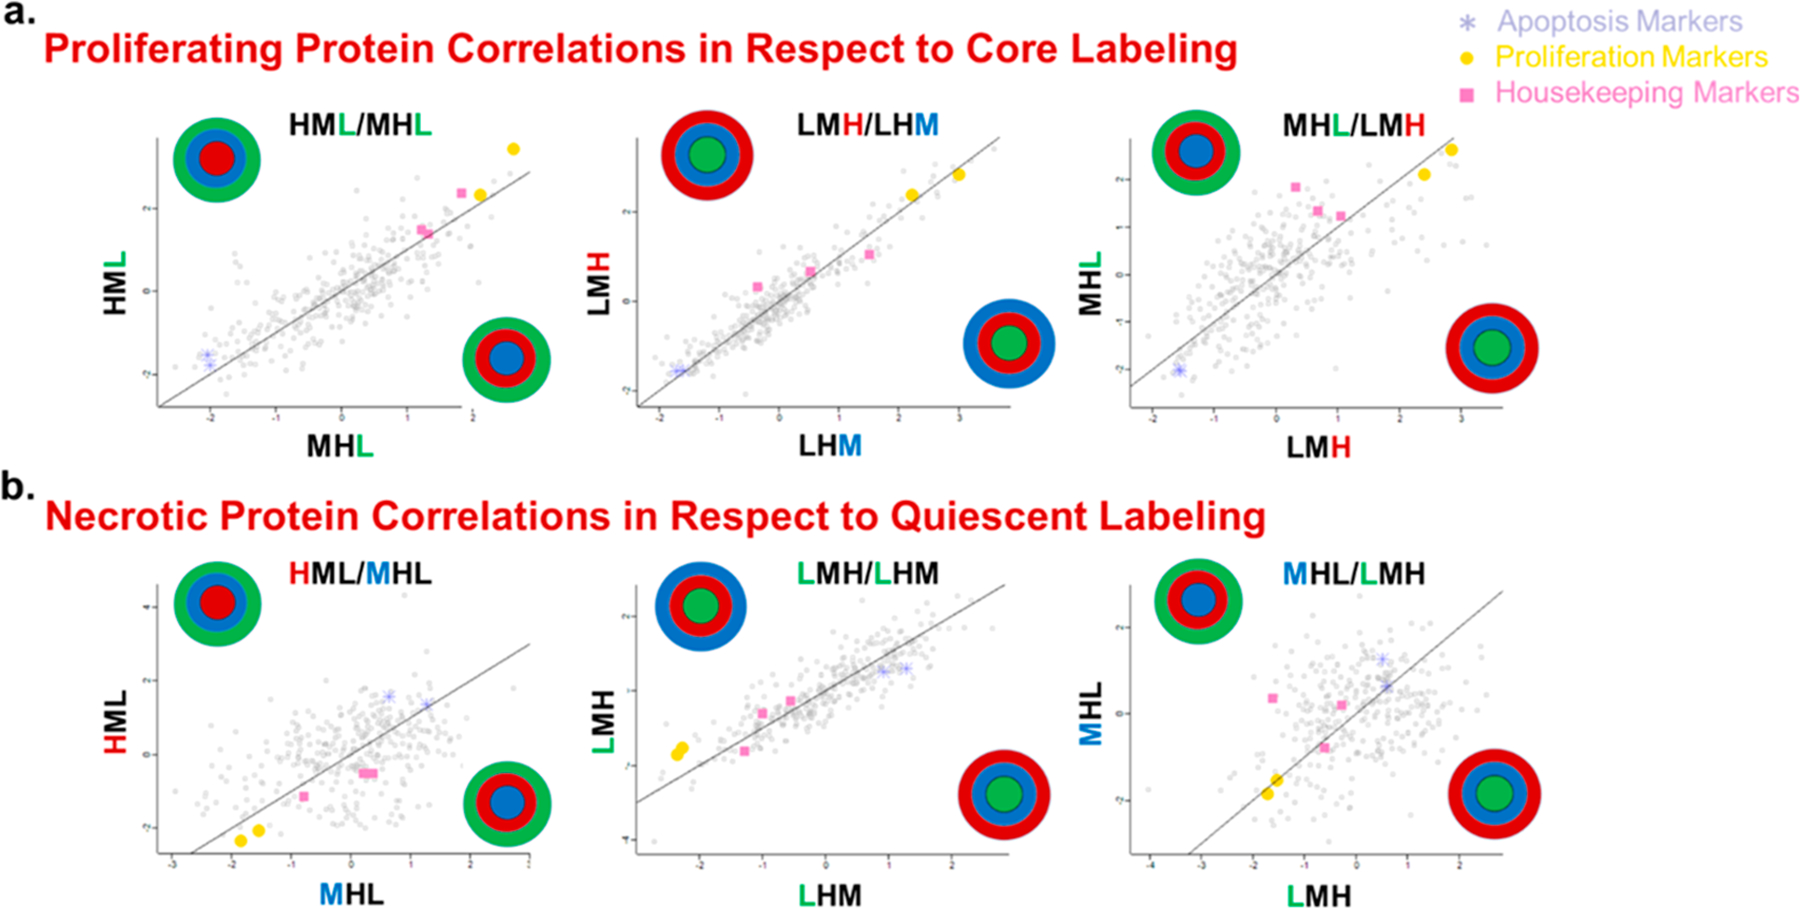
Comparison of the 406 protein quantification ratios that were present in every layer to examine labeling bias in the different spheroid layers. Each data point represents the ratio of two ratios (one on the X axis and one on the Y axis) for the SILAC ratio corresponding to each protein group. The labeled spheroids are shown on the X and Y axes, and the colored letter is the label being compared. Three comparisons are shown here for the outer layer (a), and three are shown for the core (b), while the rest can be seen in Supporting Information Figure S2. In all the comparisons, a positive correlation is present, indicating that the position of the label does not significantly affect the quantification. Positive protein correlations with respect to core labeling suggest that this technique is not biasing the observable proteome of each layer. Significant apoptosis, proliferation, and housekeeping markers are also identified to confirm that these trends are biologically relevant. (a) Proliferating protein correlations with respect to the core labeling. (b) Necrotic core correlations with respect to quiescent labeling.