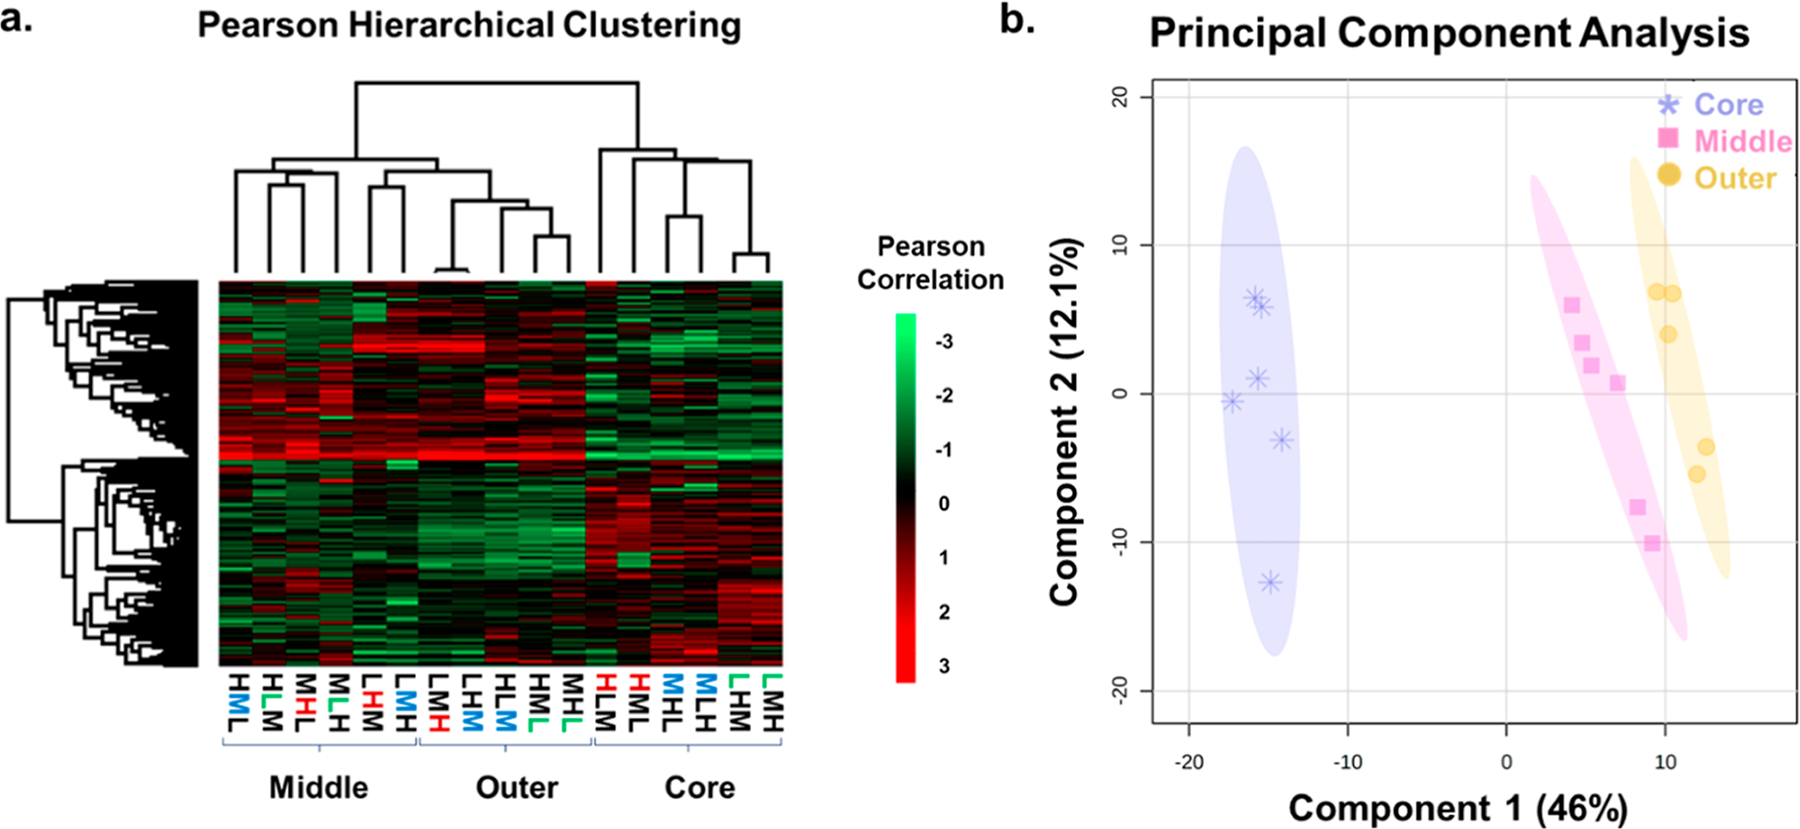
Figure 7.

(a) Hierarchical clustering by a Pearson correlation representing the proteome of each layer of the spheroid populations. Significantly upregulated proteins are shown in red, with down-regulated proteins shown in bright green. (b) PCA of each labeled layer of the spheroid populations. The layers are represented by the shape and color of the data points (purple = core, yellow = outer, and pink = middle). The spatial location (core, middle, or outer) is the primary determinant of the clustering. The protein ratios from the necrotic core cluster separated from the two outer layers. The middle and outer layers show some modest overlap with the outer cells.
