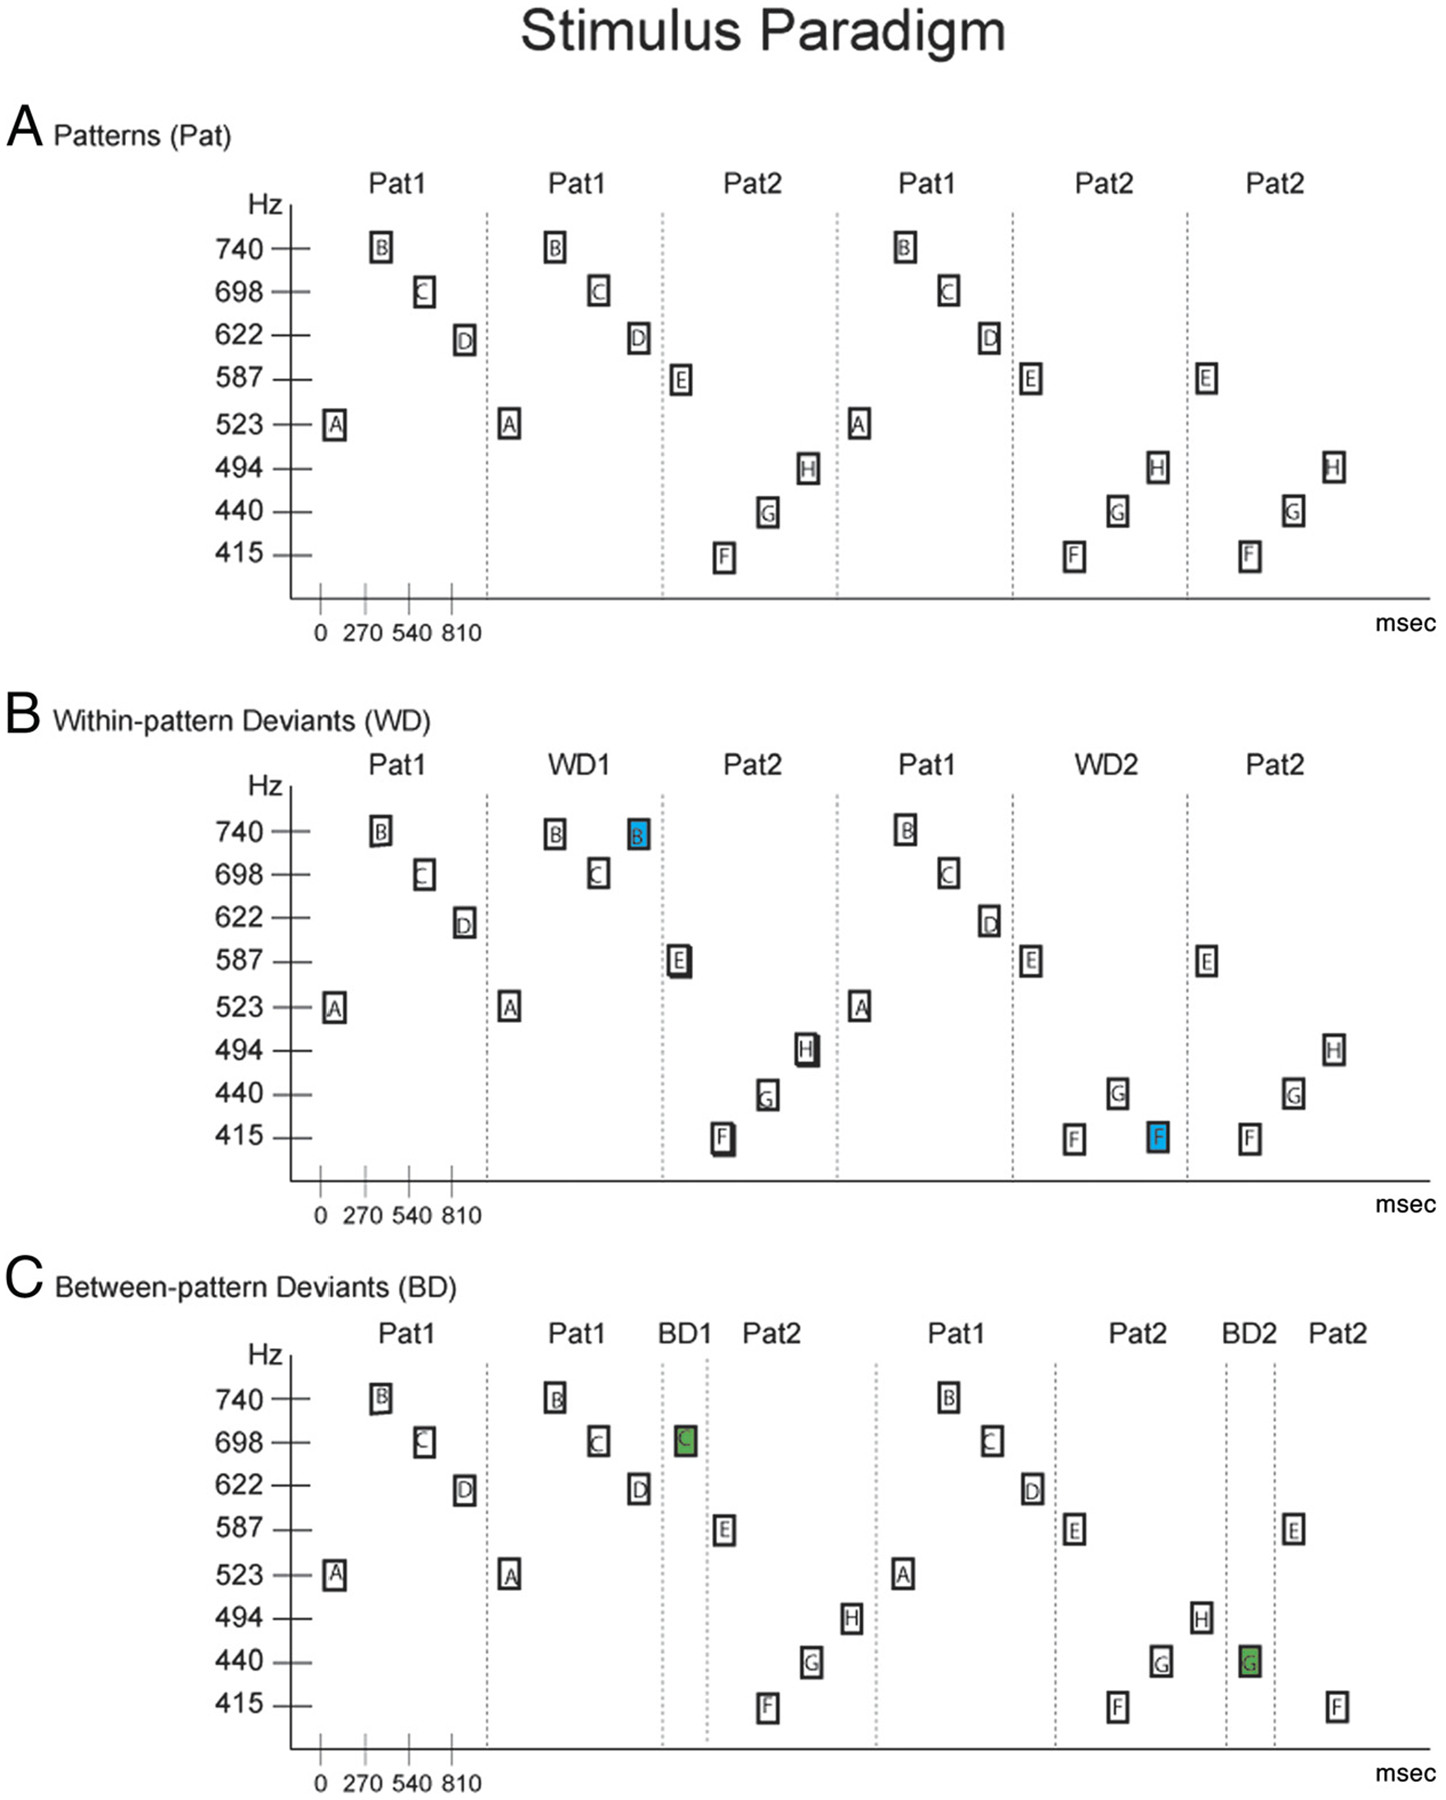
Figure 1.

Schematic diagram of the stimulus paradigm. (A) Sequential tone patterns (Pat) are depicted with rectangles, labeled ABCD (Pat1) and EFGH (Pat 2). Frequency values of the tones are displayed in Hz on the ordinate, with timing between sounds (in milliseconds) shown on the abscissa. Patterns are demarcated by a dashed vertical line for display purposes only. (B) Within-pattern deviants (WD) are displayed for Pat1 and Pat2. WD1 (blue-filled rectangle) violates expected Pat1; WD2 (green-filled rectangle) violates expected Pat2. (C) Between-pattern deviants (BD) are displayed, following Pat1 and Pat2. Between-deviant violations occur outside the borders of the four-tone patterns, serving as global deviants to the overall sequence. Dashed lines demarcate the pattern borders for display purposes only.
