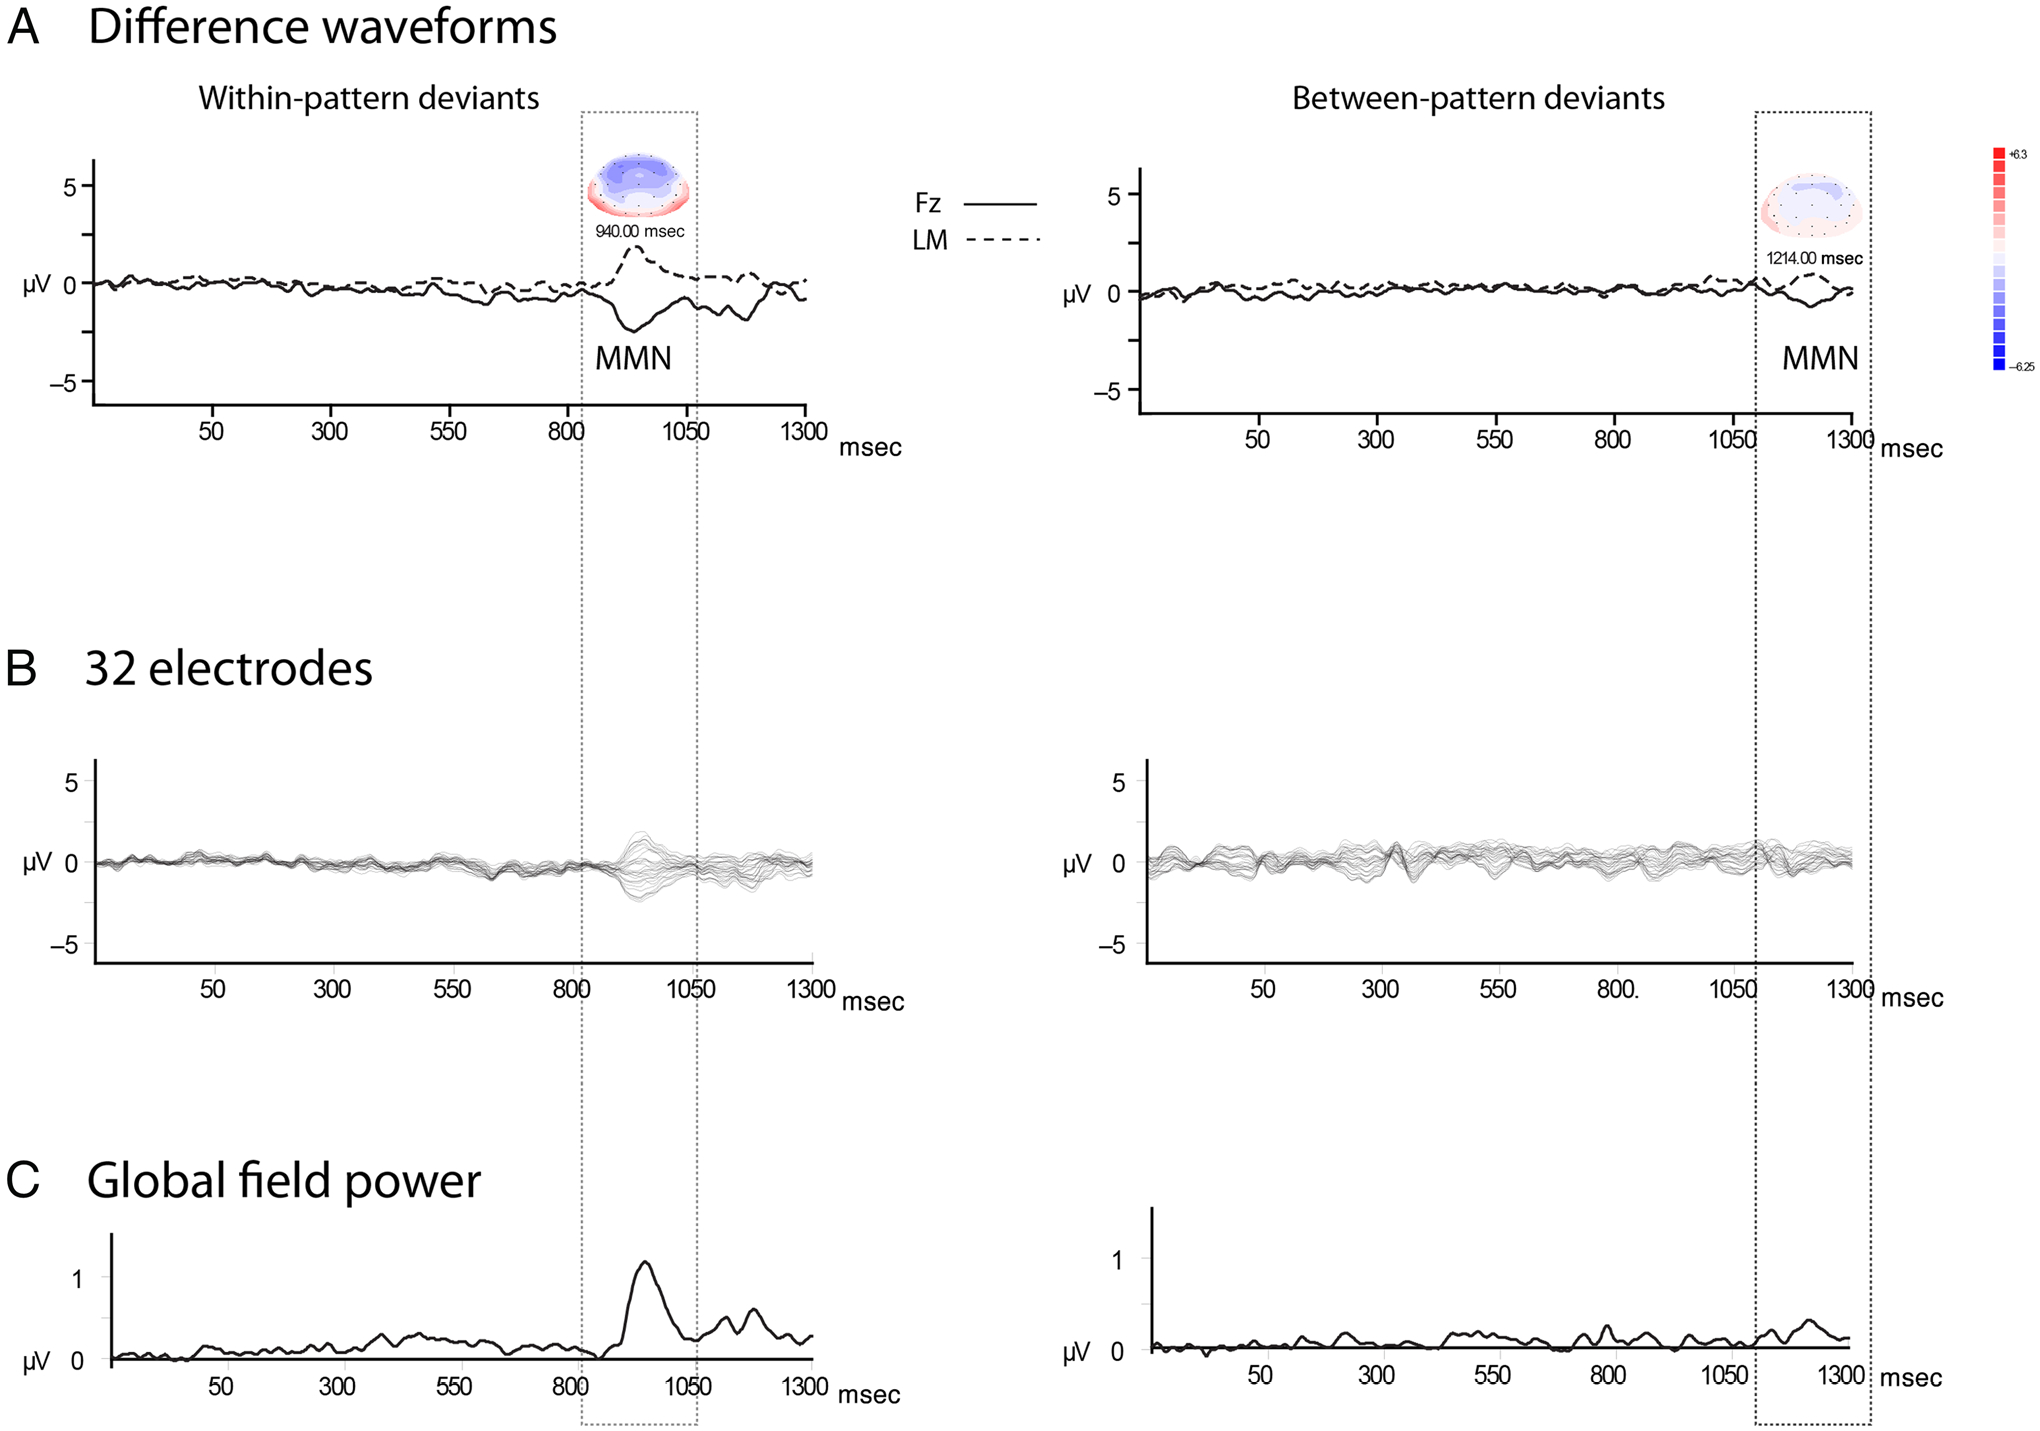
Figure 4.

Difference waveforms. (A) Grand mean difference waveforms (deviant ERP minus standard ERP) are displayed showing the MMN component (labeled MMN), with the Fz (solid line) and LM (dashed line) electrodes overlain. The vertical dotted rectangle highlights the borders of the MMN. Patterns 1 and 2 are collapsed across standards and deviants for the within-pattern deviants (left column) and between-pattern deviants (right column). Peak latency of the components is indicated above the MMN, along with voltage maps showing the scalp distribution around the head (blue represents negative polarity, and red represents positive polarity). Waveforms were time-locked to the first tone of the patterns to show the timing of deviance detection for both pattern deviants. (B) Thirty-two electrodes. Data from all 32 electrodes overlain depict the scalp distribution across the length of the epoch and tones of the patterns. MMN is clearly present for the within-pattern deviants. (C) Global field power was calculated as the spatial root mean of the squared voltage deviations across electrode recordings from the entire scalp to provide a reference-free measure for component identification. The peak of power seen in each epoch (within and between deviants) corresponds to the MMN component depicted in the ERP waveforms (A and B).
