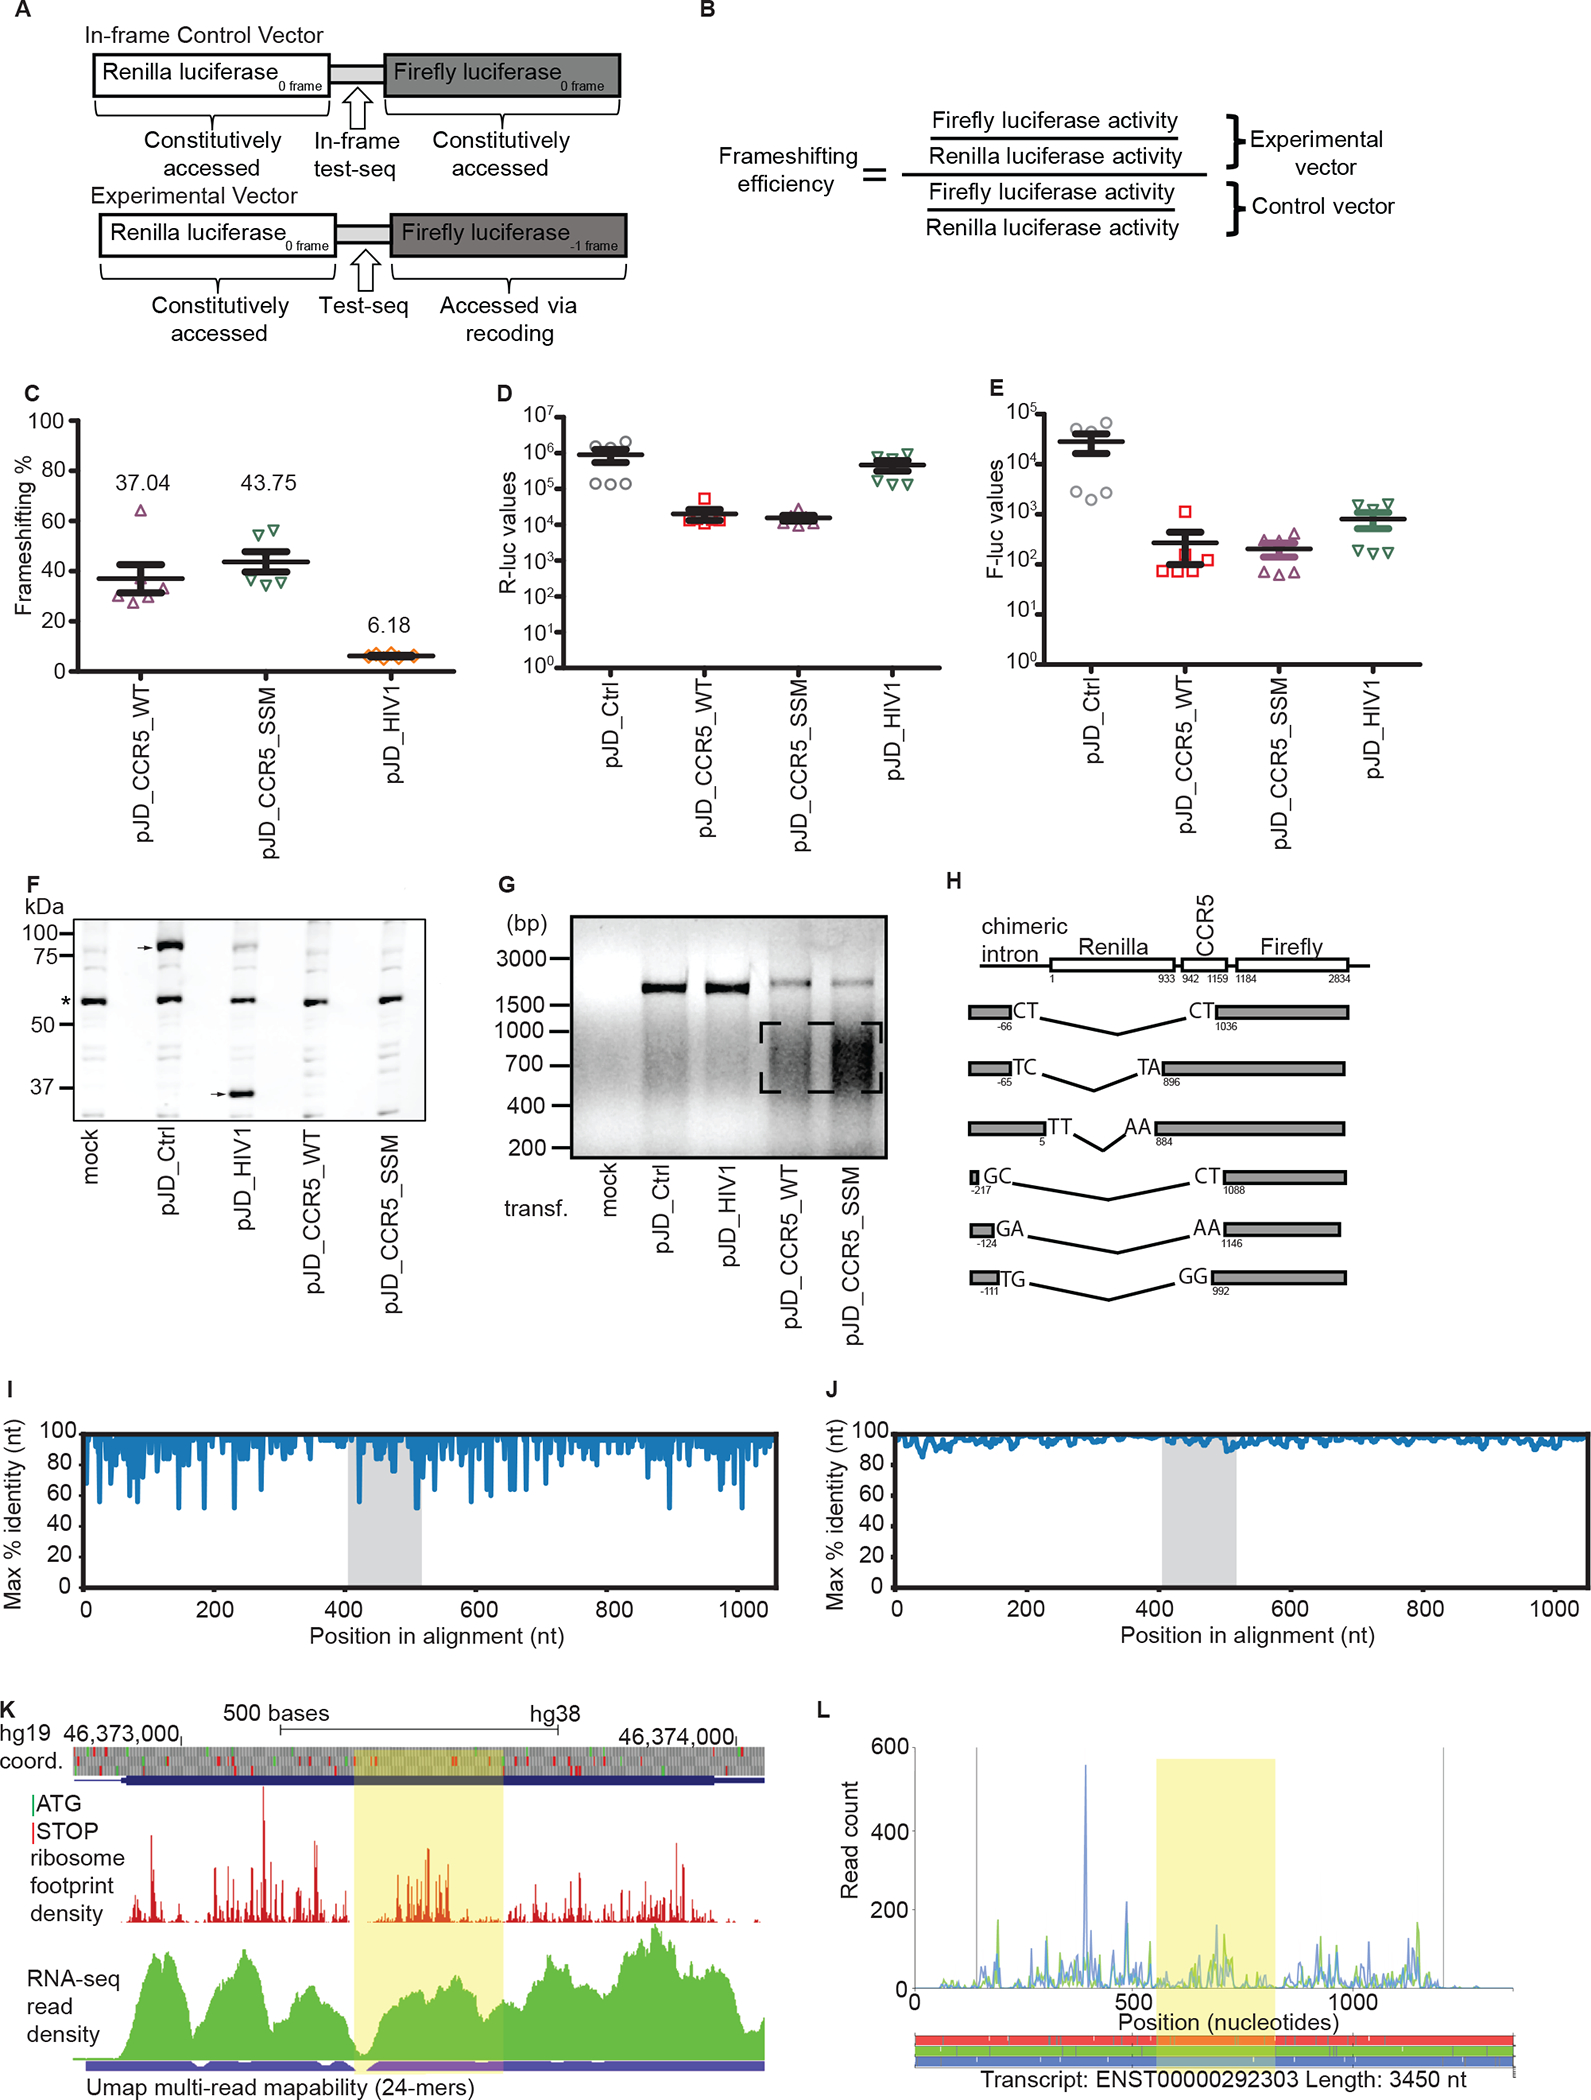
Figure 1: Evaluation of the original evidence for CCR5 frameshifting:

a. Graphical representation of the test sequence and in-frame control. b. Formula for calculating the −1 PRF efficiency. c. Relative firefly to Renilla luciferase activities, normalized to an in-frame control (pJD_Ctrl) in HeLa cells. d. Renilla luciferase activities. e. Firefly luciferase activities. c-e Each data point represents an independently transfected well of cells; error bars represent SEM; n = 2 (three separate wells of cells per sample were transfected on two different days). f. Representative anti-R-Luc immunoblot of lysates from HEK293T cells transfected with dual luciferase reporter constructs used in c-e. An asterisk indicates detection of a non-specific product that serves as a loading control. Arrow(s) indicate the presence of the reference Renilla luciferase that is always fused to firefly luciferase (pJD_Ctrl) or that is only Renilla luciferase (pJD_HIV-1). No Renilla luciferase is detected in pJD_CCR5_WT or pJD_CCR5_SSM. g. RT-PCR of dual luciferase reporter constructs used in c-e. cDNA was synthesized using gene-specific primers and analyzed by gel electrophoresis. h. Schematic representation (not to scale) of the RNA rearrangements identified by sequencing of the lower molecular mass cDNA products (see box in g). Numbers under the boxes represent location in sequence relative to the Renilla luciferase start codon. i. Single nucleotide resolution conservation analysis (max % identity) of the CCR5 CDS for primates only, excluding Lemur catta. j. 10-nucleotide sliding window analysis of conservation in the CCR5 CDS for primates only, excluding Lemur catta. The area containing the putative frameshift region is highlighted in grey. The accession numbers of the sequences used are indicated in bold in Supplementary Table 1B. k-l. GWIPS-viz (k) and Trips-Viz (l) visualizations of ribosome profiling data obtained in monocytes. The region downstream of the putative frameshift site up to the next −1 frame stop codon is highlighted in yellow. GWIPS-viz screenshot displaying ribosome footprints aligning to the genomic locus corresponding to the protein coding exon of CCR5. Reduced density is observed at the frameshift site and immediately downstream due to low mapability (blue bar; ambiguous mapping is disallowed). Trips-Viz screenshot displaying ribosome footprints aligning to the CCR5 ENSEMBL transcript; only footprints supporting translation in the zero (blue) and −1 (green) frames are shown. Ambiguous read mapping is allowed.
