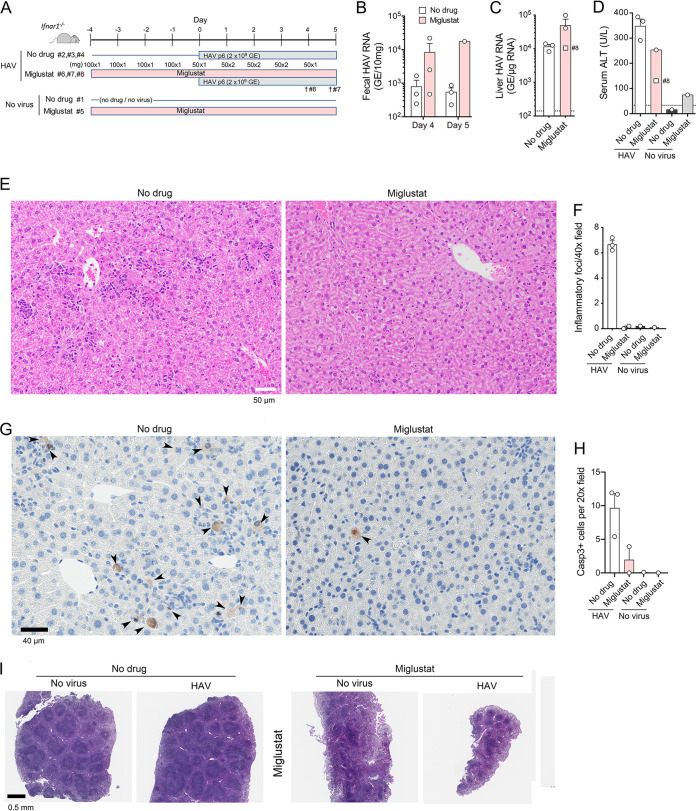
FIG 2.
HAV infection in miglustat-treated Ifnar1−/− mice. (A) Experimental scheme showing two groups of 3 mice receiving miglustat (100 mg per day) or an equal volume of the water control by gavage for 4 days prior to i.v. challenge with mouse-passage 6 (mp6) HAV. Due to diarrhea in the treated animals, the miglustat dosage was modified as shown beginning on the day of infection. Miglustat-treated animals 8 and 7 were found moribund on days 4 and 5 p.i., respectively. (B) HAV RNA quantified by RT-PCR in feces from mice at days 4 and 5 p.i. (fecal samples were not available from mice 7 and 8 on day 5). (C) HAV RNA quantified by RT-PCR in liver tissues at necropsy on day 5 (day 4 for mouse 8). (D) Serum ALT activities at necropsy on day 5 (day 4 for mouse 8; no serum available from mouse 7). The dashed horizontal line represents the upper limit of normal. (E) Liver sections from HAV-infected animal 3 (no drug group), showing numerous apoptotic hepatocytes and diffuse parenchymal inflammatory cell infiltrates (top), and animal 6 (miglustat group), showing normal hepatic architecture, no apoptosis, and no inflammatory infiltrates (bottom). (F) Histopathology scores for hepatic inflammation from reading of 10 randomly selected 40× microscopic fields in a blind manner. Liver from mouse 8 was a poor-quality sample and not included. (G) Immunohistochemical staining for cleaved caspase 3 in liver sections from animals 3 and 6 (left to right). (H) Mean numbers of hepatocytes staining for cleaved caspase 3 per 20× microscopic field in 10 randomly selected fields of view. (I) H&E-stained sections of spleens from animals 1, 3, 5, and 6 (left to right).

