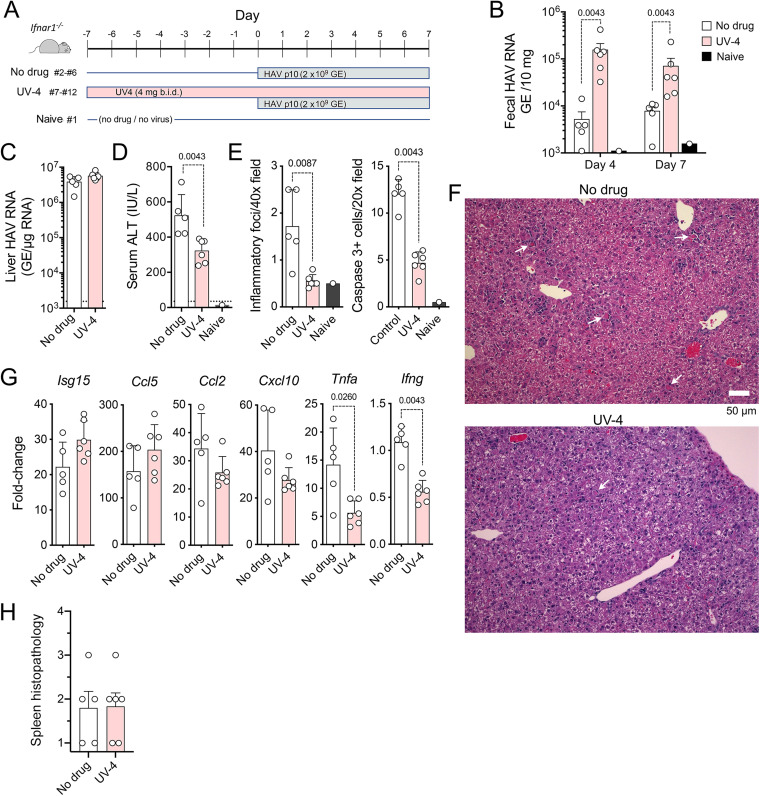
FIG 6.
HAV infection in UV-4-treated Ifnar1−/− mice. (A) Infection scheme with 3 groups of mice. Groups of mice received 4 mg UV-4 [N-(9-methoxynonyl)-1-deoxynojirimycin] in 200 μl water (n = 6) or an equal volume of the water control (n = 5) twice daily (b.i.d.) by gavage for 7 days prior to and 6 days following i.v. challenge with HM175-mp10 mouse-passaged HAV. A single mouse (mouse 1) was monitored in parallel with no drug and no virus challenge as a contemporary control. Mice were necropsied at 7 days p.i. (B) HAV RNA quantified by RT-qPCR in feces from mice at days 4 and 7 p.i. (C) HAV RNA quantified by RT-PCR in liver tissues at necropsy. (D) Serum ALT activities at necropsy. The dashed horizontal line represents the upper limit of normal. (E) Histopathology and cleaved caspase 3-positive cell scores for liver tissues from reading of 10 randomly selected microscopic fields performed in a blind manner. (F) Representative microscopic fields of hematoxylin- and eosin-stained liver tissue from mouse 5 (no drug; pathology score = 15) (top) and mouse 7 (UV-4 treated; pathology score = 5) (bottom). Arrows indicate apoptotic hepatocytes, some with a surrounding inflammatory infiltrate. (G) RT-qPCR quantitation of cytokine transcripts in liver tissue collected at 7 days p.i. Data are presented as fold changes from the uninfected, untreated control animal (mouse 1), relative to actin mRNA. (H) Splenic histopathology scores in UV-4-treated and untreated mice. Spleens were scored in a blind manner according to the following scale: 1 for normal, 2 for a minimal (approximately <30%) decrease in white pulp, 3 for a moderate decrease in the overall size and disrupted organization of the periarteriolar lymphoid sheath, and 4 for a complete loss of lymphoid cells. In all panels, pairwise comparisons were performed by a two-tailed Mann-Whitney test; significant (P < 0.05) P values are noted.

