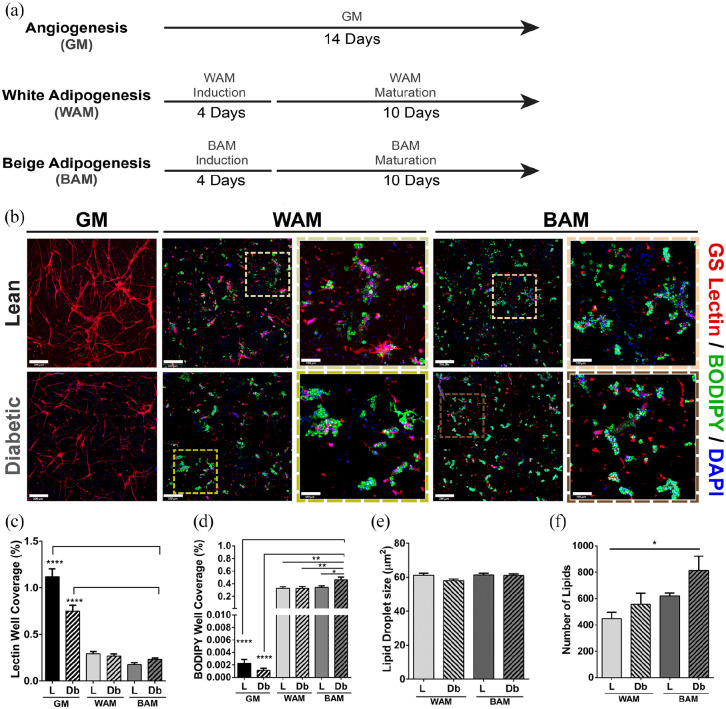
Figure 1.
Immunofluorescence analysis of direct lean (L) and diabetic (Db) microvascular fragment beige adipogenic differentiation after 14 days. (a) Schematic describing the first experiment and showing the different groups tested. (b) Representative confocal images of microvascular fragments grown in fibrin scaffolds and stained with GS-Lectin I (red) to visualize vascular network formation and BODIPY (green) to identify the presence of lipid droplets (full view scale bar = 300 µm, inset scale bar = 100 µm). (c and d) Quantitative analysis of vessel and lipid formation as determined with GS Lectin I (Lectin) or boron-dipyrromethene (BODIPY) accumulation, respectively. Quantification performed as a measurement of % well coverage within wells. (e and f) Quantification of lipid droplet size and number of lipids, respectively, per well. Subcutaneous (SUBQ) fat was used as the source of microvascular fragments. Results are reported as mean ± standard error of two experimental replicates (n = 6 per experiment). *p < 0.05, **p < 0.01, ***p < 0.001, ****p < 0.0001. Lines across the experimental group indicate statistical significance relative to all groups.

