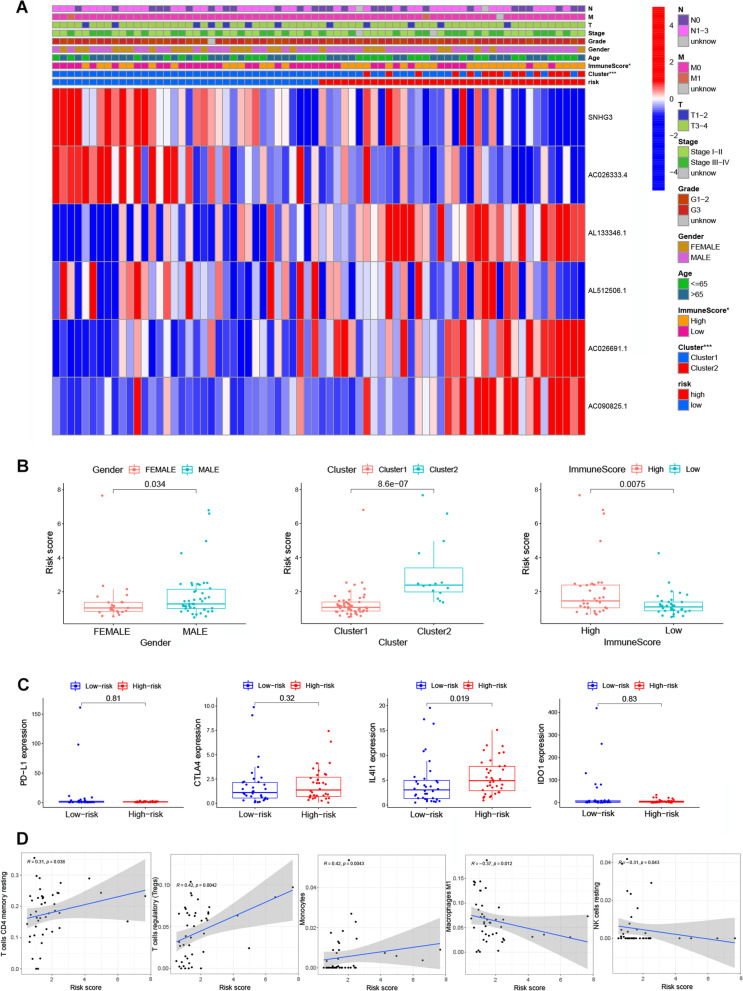
Fig. 8.
A heat map and box plot showing the relationship between risk scores with clinical features and immune cells. A A heatmap showing the correlation between risk scores and clinical characteristics. B Box plot showing the correlation between risk scores and clinical characteristics. C Profiles of PD-L1, CTLA4, IL4I1, and IDO1 expression in the high- and low-risk groups. D The correlation between risk scores with expression of immune cells, including resting memory CD4+ T cells, regulatory T cells, Monocytes, M1 macrophages and resting NK cells

