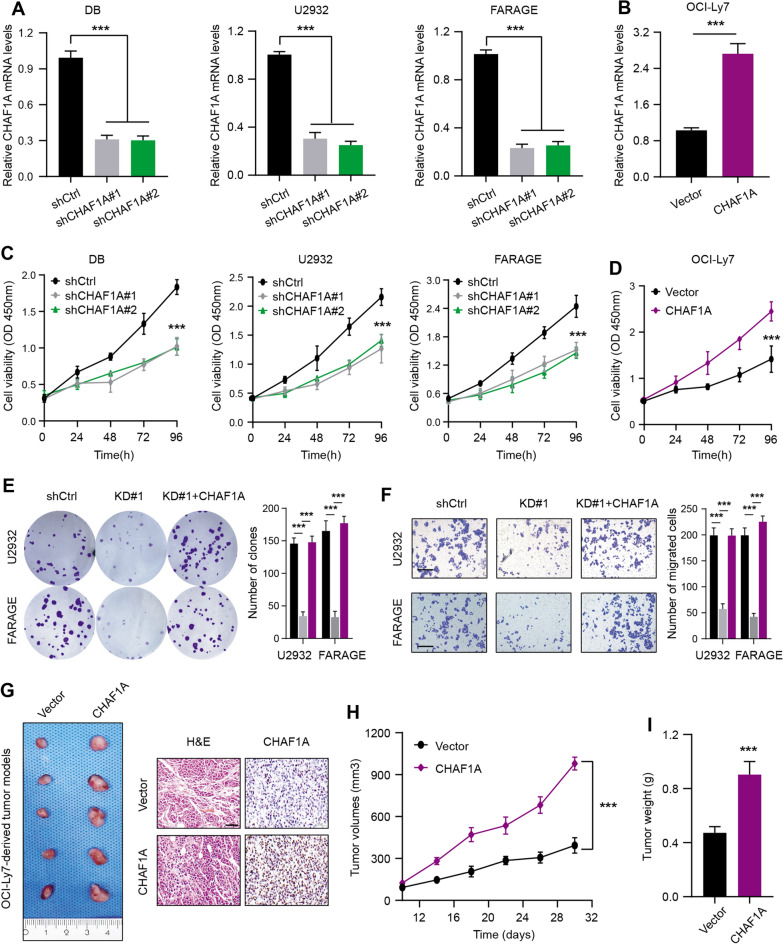
Fig. 2.
High CHAF1A exerts tumor-promoting biological effects in DLBCL. A The RT-qPCR analysis indicated the down-regulated CHAF1A mRNA expressions shCHAF1A DLBCL cell lines (DB, U2932 and FARAGE) and shCtrl cells. B The RT-qPCR analysis indicated the elevated CHAF1A expressions in EV and OE OCI-Ly7 cells. C MTT assay showed suppressed cell viability when CHAF1A was knocked down by shCHAF1A in three independent DLBCL cell lines as compared to control (shCtrl) cells. D In contrast, CHAF1A overexpression could cellular proliferative activity of OCI-Ly7. E The colony generation of DLBCL cells by colony formation assays showed CHAF1A KD could attenuate colony formation ability, but CHAF1A OE could rescue the suppressed capacity. F Besides, CHAF1A KD could also attenuate migration ability of cells by Transwell assay, but CHAF1A OE could also rescue the impaired migration capacity. G Animal assays on nude mice with OCI-Ly7 cells showed enhanced tumor growth rate in the CHAF1A OE group compared with the control group (EV). Representative tumor graphs were shown on the left, while H&E and IHC staining of Ki-67 were exhibited on the right. Scale bar = 50 μm H Record of tumor volumes at the indicated timepoints and generation of tumor growth curves in two mice groups. I After the animal sacrifice, tumor weight of mice derived from the two groups were compared. Experiments were performed in triplicate. *p < 0.05, **p < 0.01, ***p < 0.001

