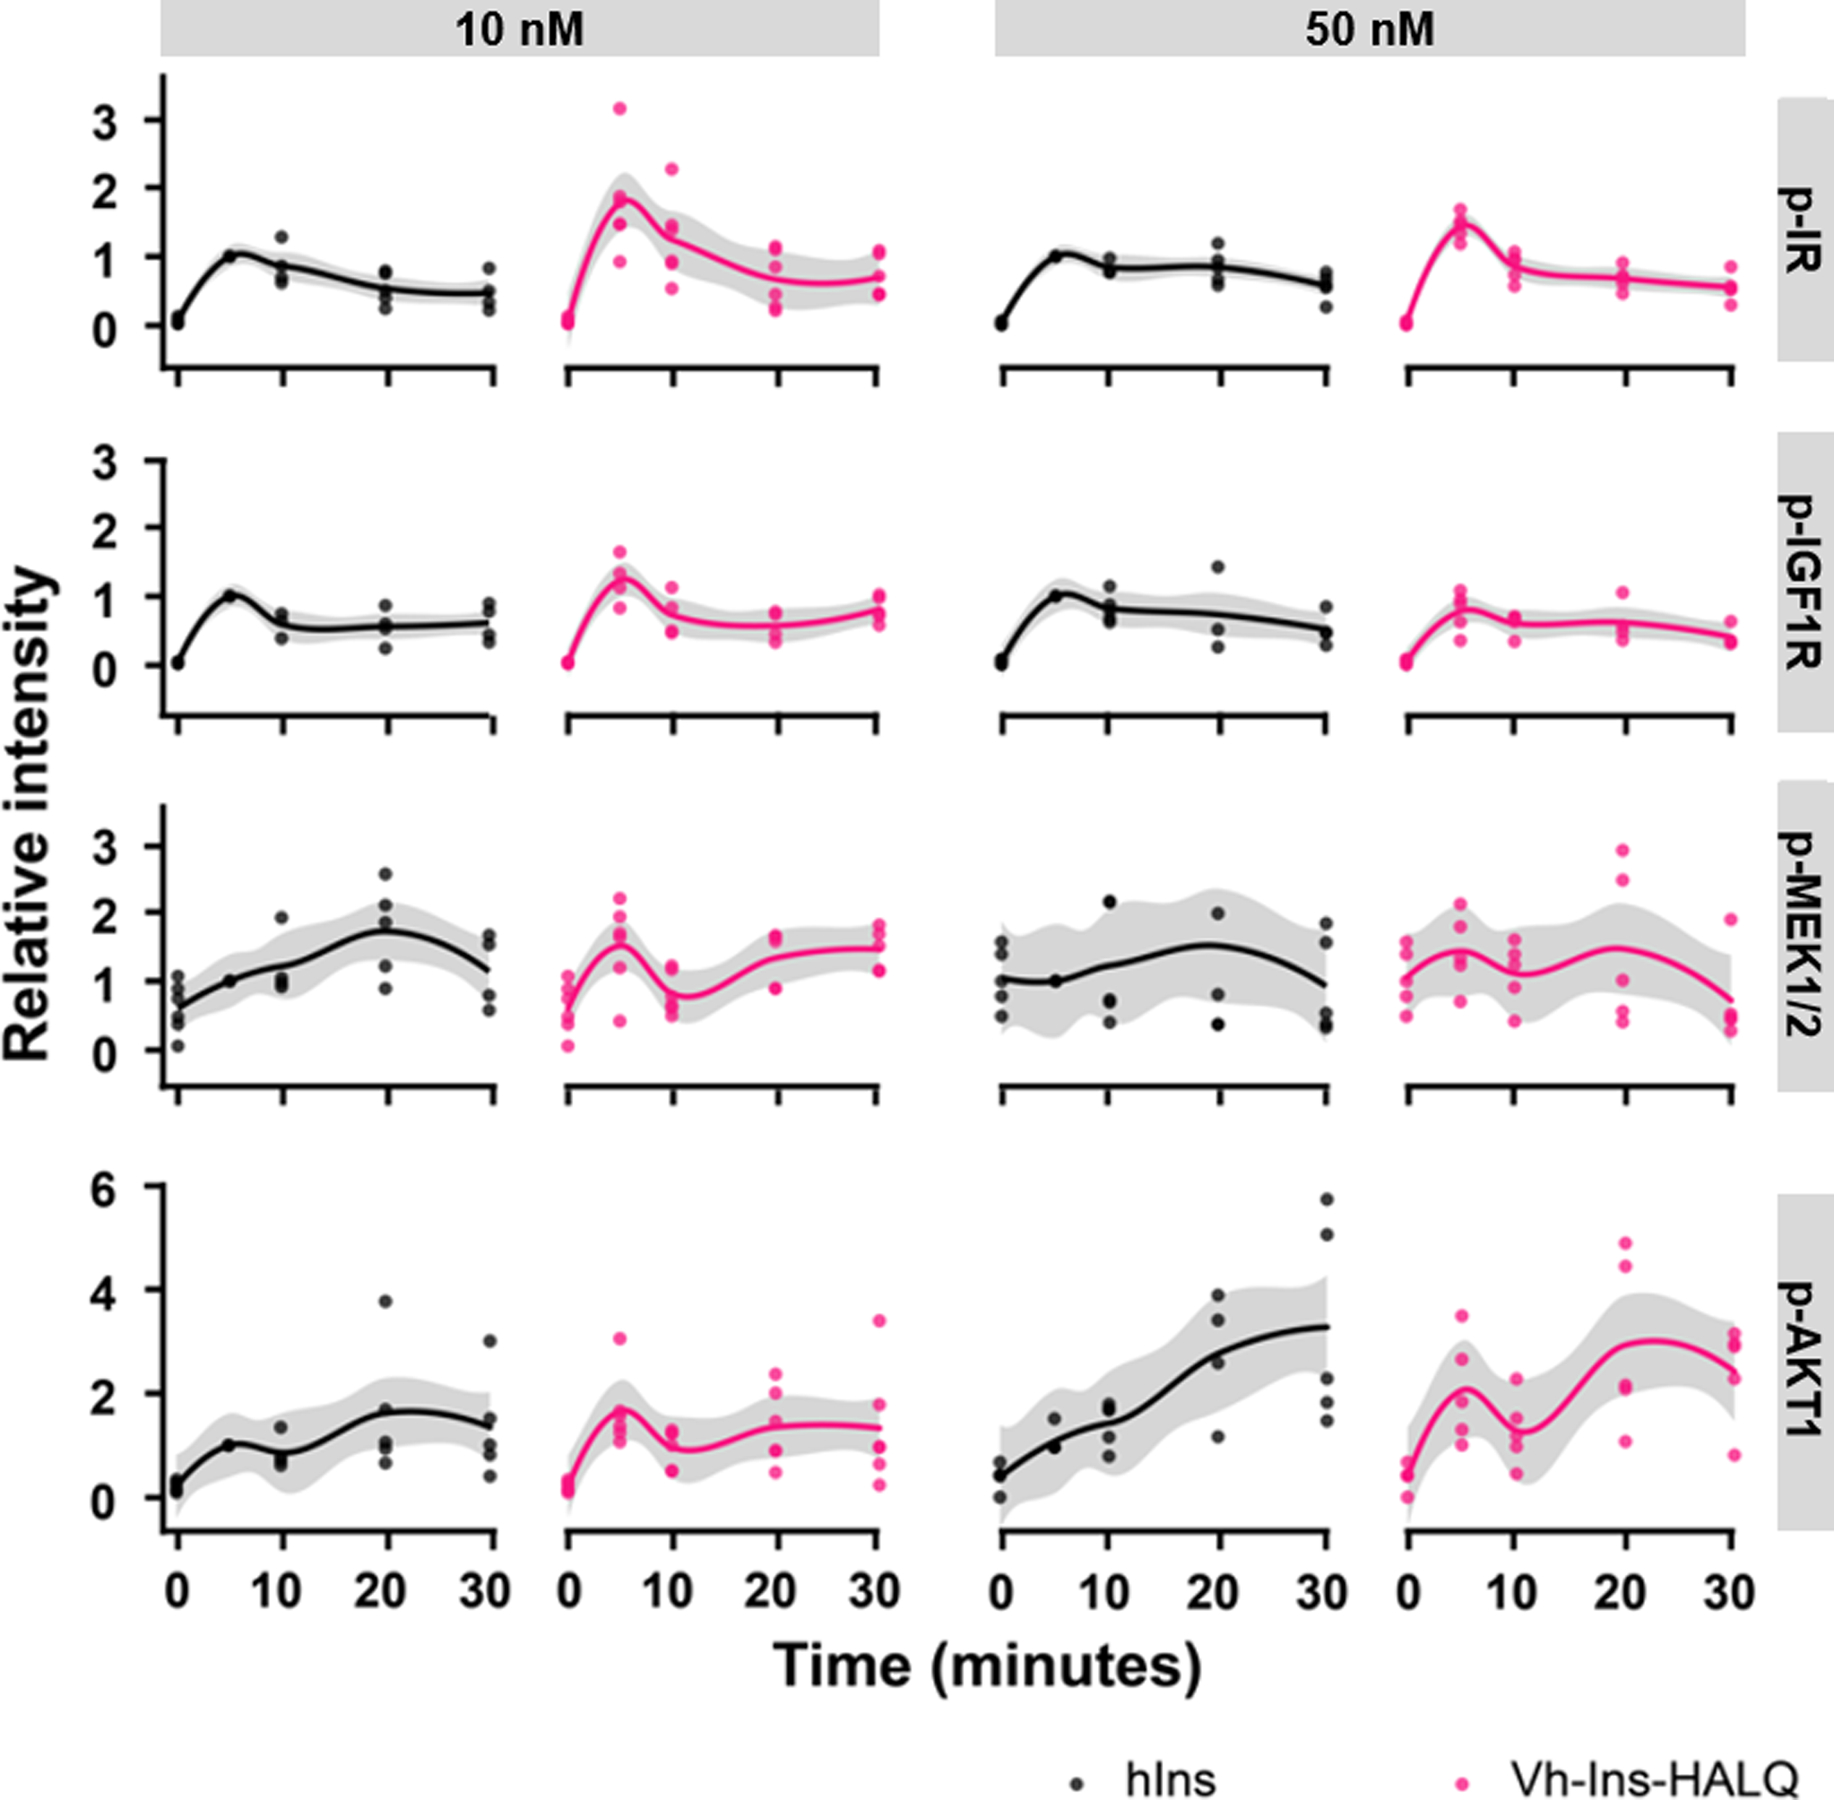
Extended Data Fig. 7. Vh-Ins-HALQ signal transduction in Hep-G2 cells.

Signal transduction in Hep-G2 hepatoblastoma cells induced by Vh-Ins-HALQ and hIns at 10 or 50 nM was assessed by Western blot and densitometry (4–6 biological replicates for each condition). Phosphorylation-specific antibodies were used to detect phosphorylated IR (Y1150/115), IGF1R (Y980), AKT1 (S473), and MEK-1/2 (S217/221). Relative intensities of specific protein bands were normalized to the GAPDH loading control and then to the respective signal after 5 min of insulin treatment.
