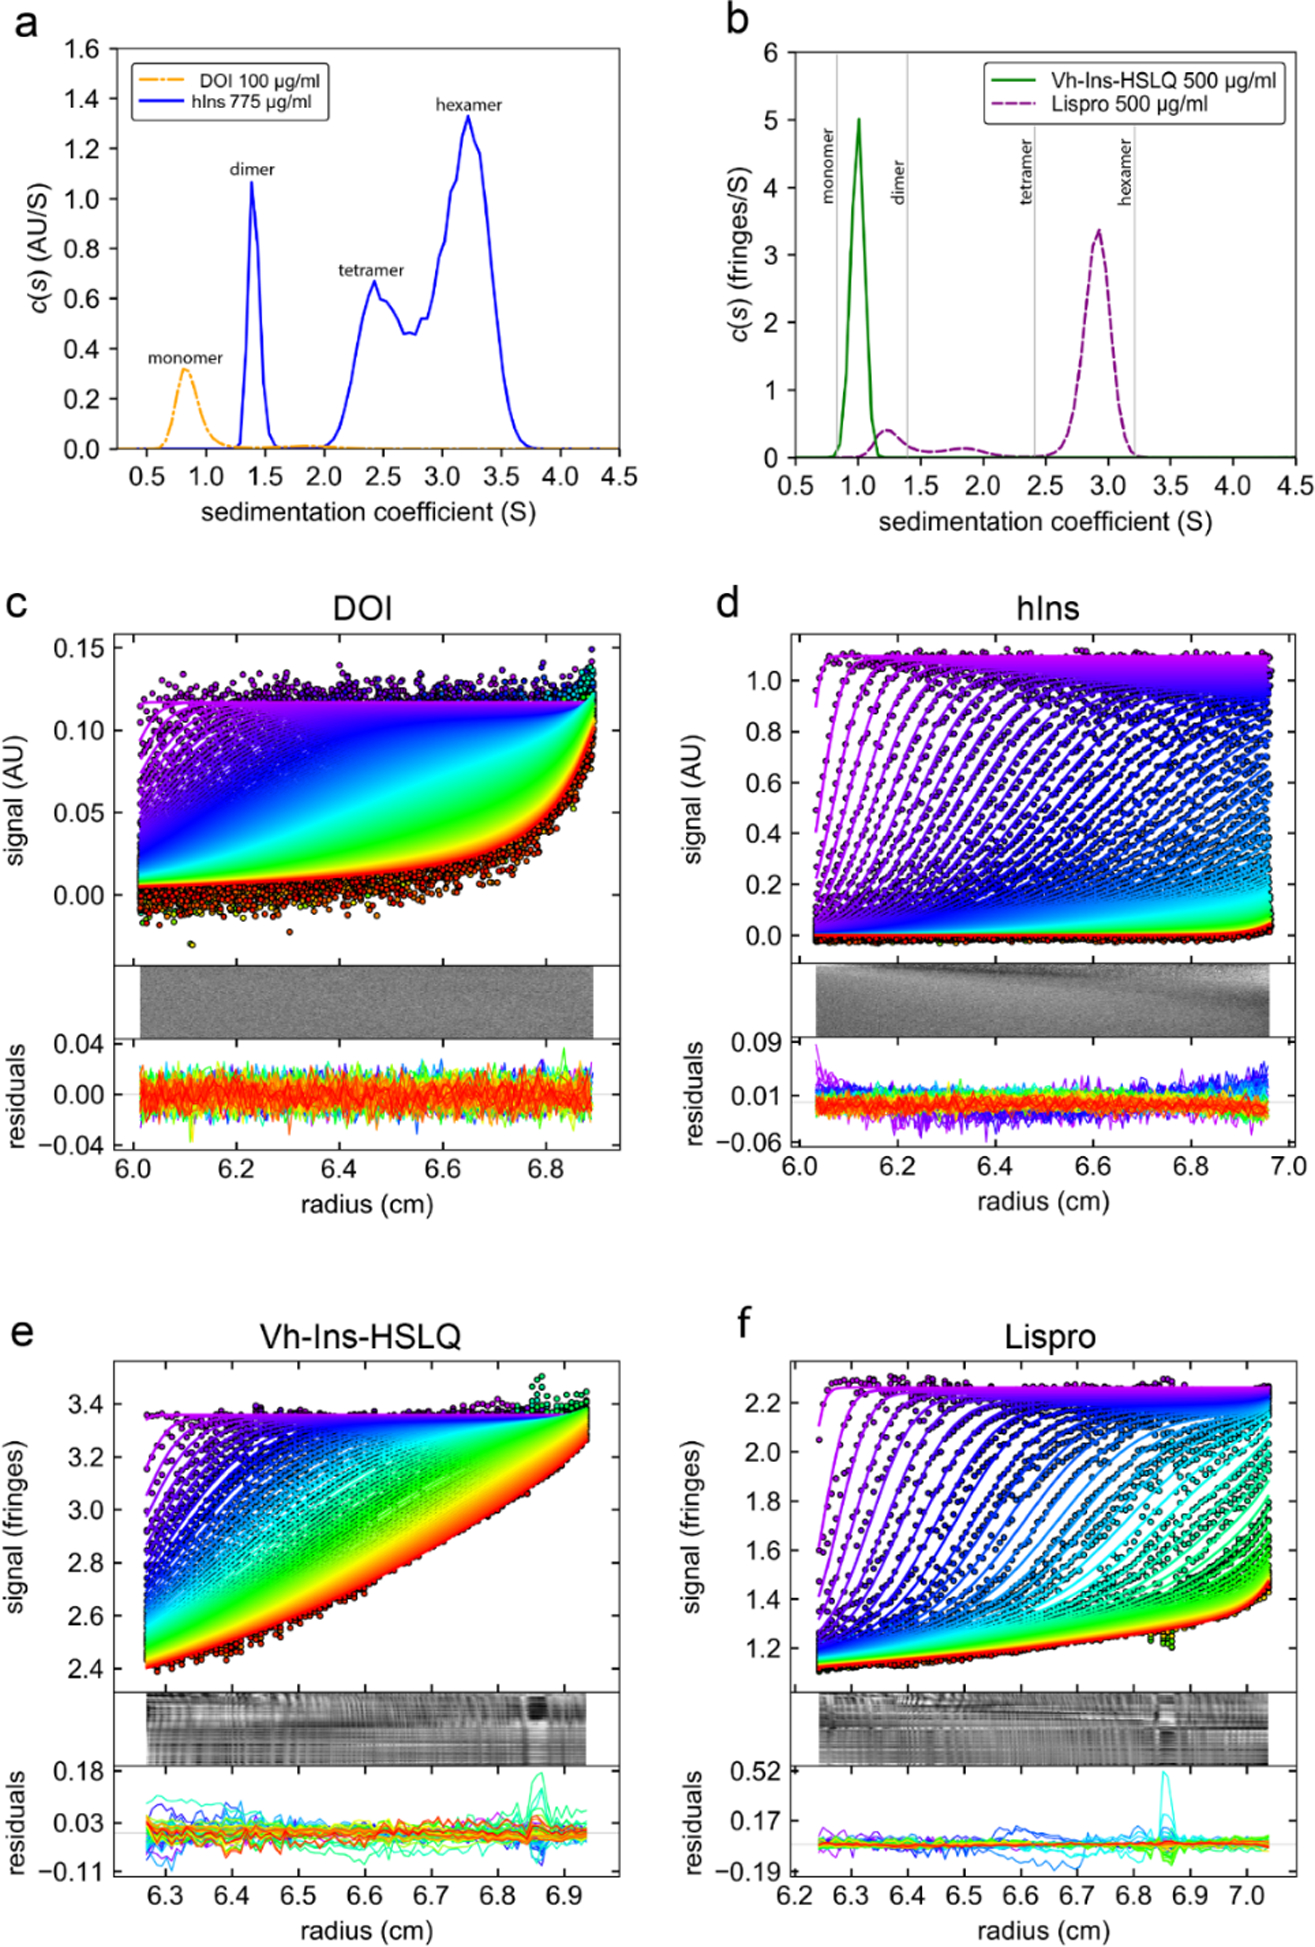
Extended Data Fig. 8. SV-AUC c(s) analysis of insulin analogs.

a, DOI (des octapeptide insulin) and hIns (human insulin) controls at a concentration of 100 μg/ml and 775 μg/ml respectively in phosphate buffer (137 mM NaCl, 2.7 mM KCl, 5.3 mM Na2HPO4, 1.8 mM KH2PO4, pH 7.4). b, Vh-Ins-HSLQ and Lispro both at 500 μg/ml in sterile insulin diluent (16 mg/ml glycerol, 1.6 mg/ml m-cresol, 0.65 mg/ml phenol, 3.8 mg/ml Na2HPO4, pH 7.4). c-d, Data fit and residuals for DOI, hIns, Vh-Ins-HSLQ and lispro, respectively. For clarity, some scans are omitted from the figures shown but all scans were used for the c(s) analysis. The interval between the scans shown in each panel is ~9 minutes.
