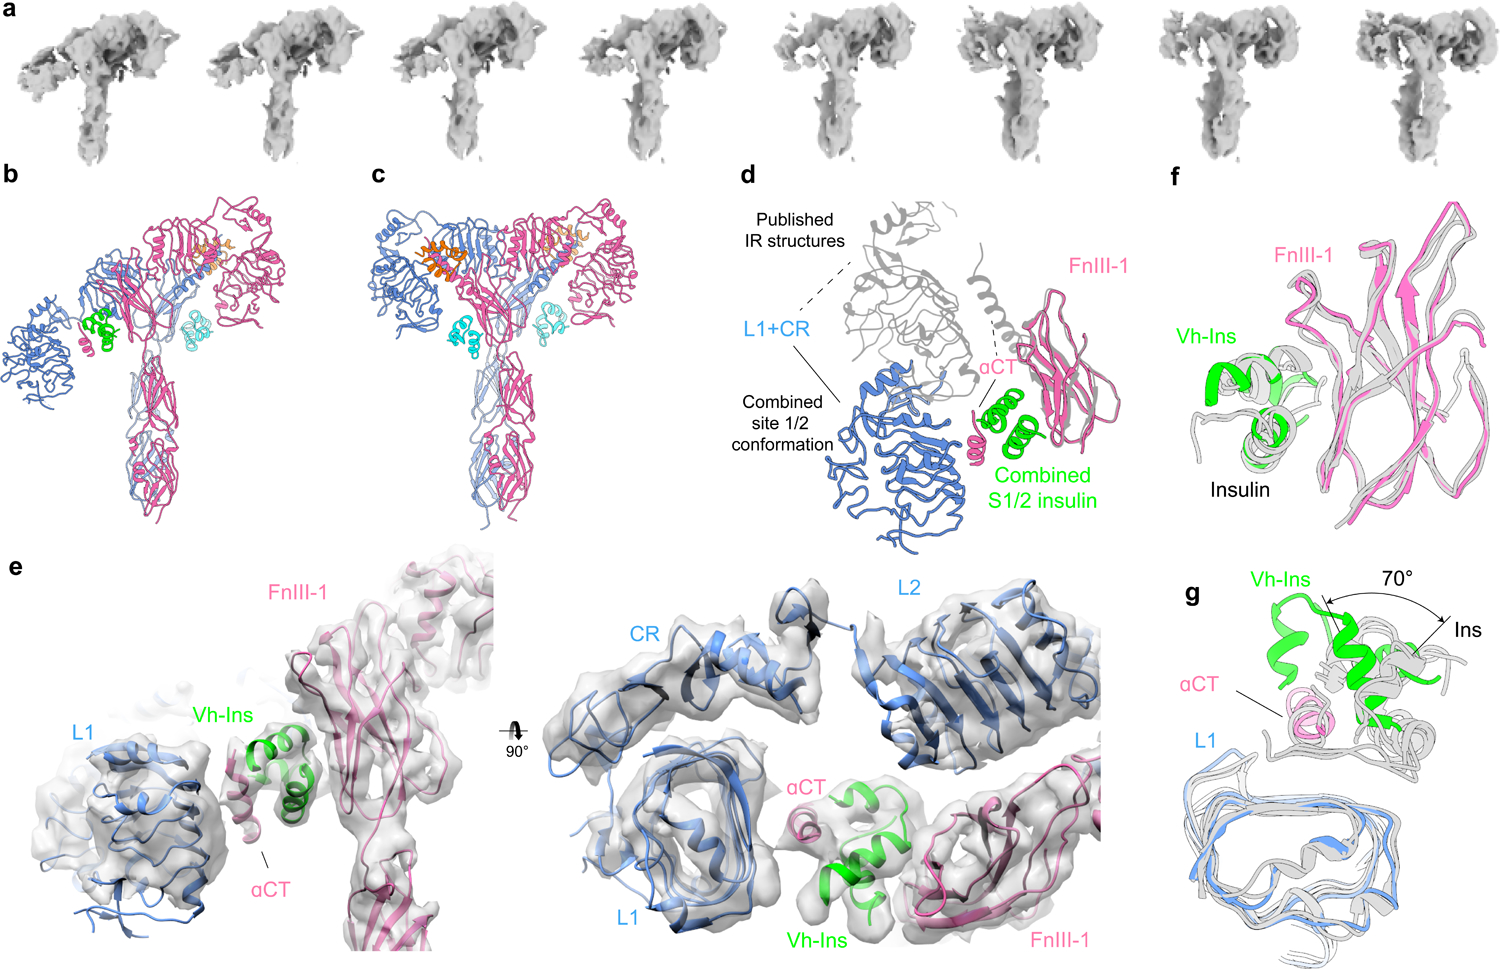
Fig. 5 |. Conformational heterogeneity in Vh-Ins-HSLQ-receptor reconstructions.

a, The conformational trajectory solved by 3D variability analysis depicted as a series of eight maps b, Model of the most asymmetric extreme. Three Vh-Ins-HSLQ molecules are bound. Site-1 (orange) and site-2 (cyan) positions are occupied for the right-hand “up” protomer of the receptor in the same manner as the symmetric conformation (Fig. 2). One Vh-Ins-HSLQ is bound to the left-hand “down” protomer of the receptor at the combined 1/2 site (green) that approximates a combination of site-1 and site-2 interactions. c, Model of the conformational state that most closely resembles a two-fold symmetric ectodomain complex, built into a 6.0 Å map. Vh-Ins is apparent at both site 1 positions (orange) and for site-2 Vh-Ins (cyan). d, Apparent motion of L1, CR and αCT when site-1 and site-1/2 structures are superimposed on the FnIII-1 domains. e, 4.4 Å map and model of the asymmetric conformation and the combined site 1/2. The resolution is sufficient to model the location and orientation of all domains, although the register of the αCT helix is not clear. f, Comparison of site-2-bound human insulin (PDBs 6SOF14, 6PXW16) with Vh-Ins-HSLQ at the combined site-1/2 position following structural alignment with the FnIII-1 domain g, Comparison of site-1-bound human insulin (PDBs 6HN517, 6SOF14, 6PXW16) with Vh-Ins-HSLQ at the combined site-1/2 position following structural alignment with the L1 domain.
