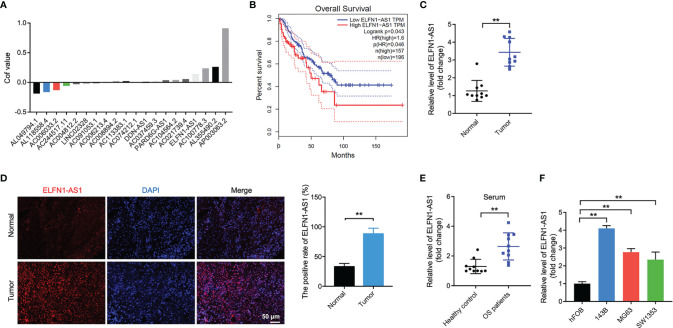
Figure 1.
ELFN1-AS1 levels are elevated in OS tissues and OS cells. (A) In the TARGET dataset, 8 downregulated DElncRNAs, and 12 upregulated DElncRNAs from OS tissues and corresponding normal controls were identified using LASSO Cox regression analysis. Volcano plot of DElncRNAs in TARGET dataset. (B) The correlation between the level of ELFN1-AS1 and overall survival rate of patients with OS in the TCGA dataset. (C) ELFN1-AS1 level in OS tissues and matched normal sample tissues were measured using RT-qPCR (n = 10). The data were statistically analyzed using Student’s t-test. (D) FISH staining analysis of ELFN1-AS1 level in OS tissues and matched normal tissues. (E) ELFN1-AS1 level in serum samples from patients with OS and healthy controls were measured using RT-qPCR (n = 10). The data were statistically analyzed using Student’s t-test. (F) RT-qPCR analysis of ELFN1-AS1 level in MG63 and SW1353 cells (n = 3). The significance between groups was analyzed by one-way ANOVA. **P < 0.01.

