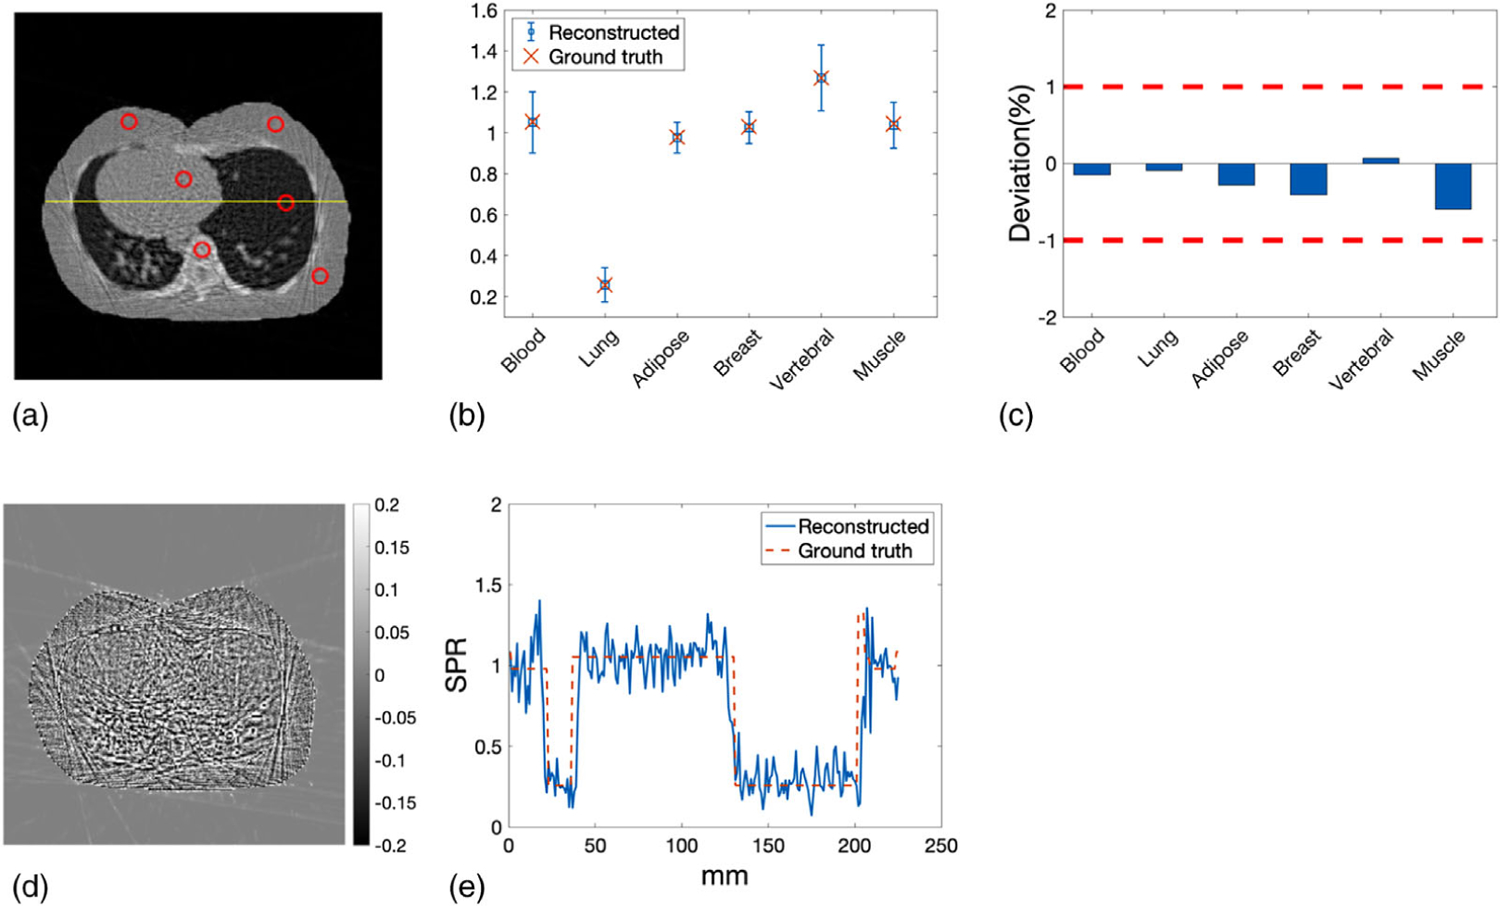
FIGURE 13.

(a) ROIs representing different tissue types in the lung slice where the mean and STD of SPR were calculated. (b) The mean of reconstructed SPR in every ROIs compared with ground truths. Error bars indicate the STD of SPR within each ROI. (c) Deviations of reconstructed SPR in ROIs from the ground truths. (d) Difference between reconstructed SPR and reference SPR of the lung slice. (e) Profile comparison of reconstructed SPR and reference SPR along the yellow line delineated in panel (a)
