
FIGURE 14.
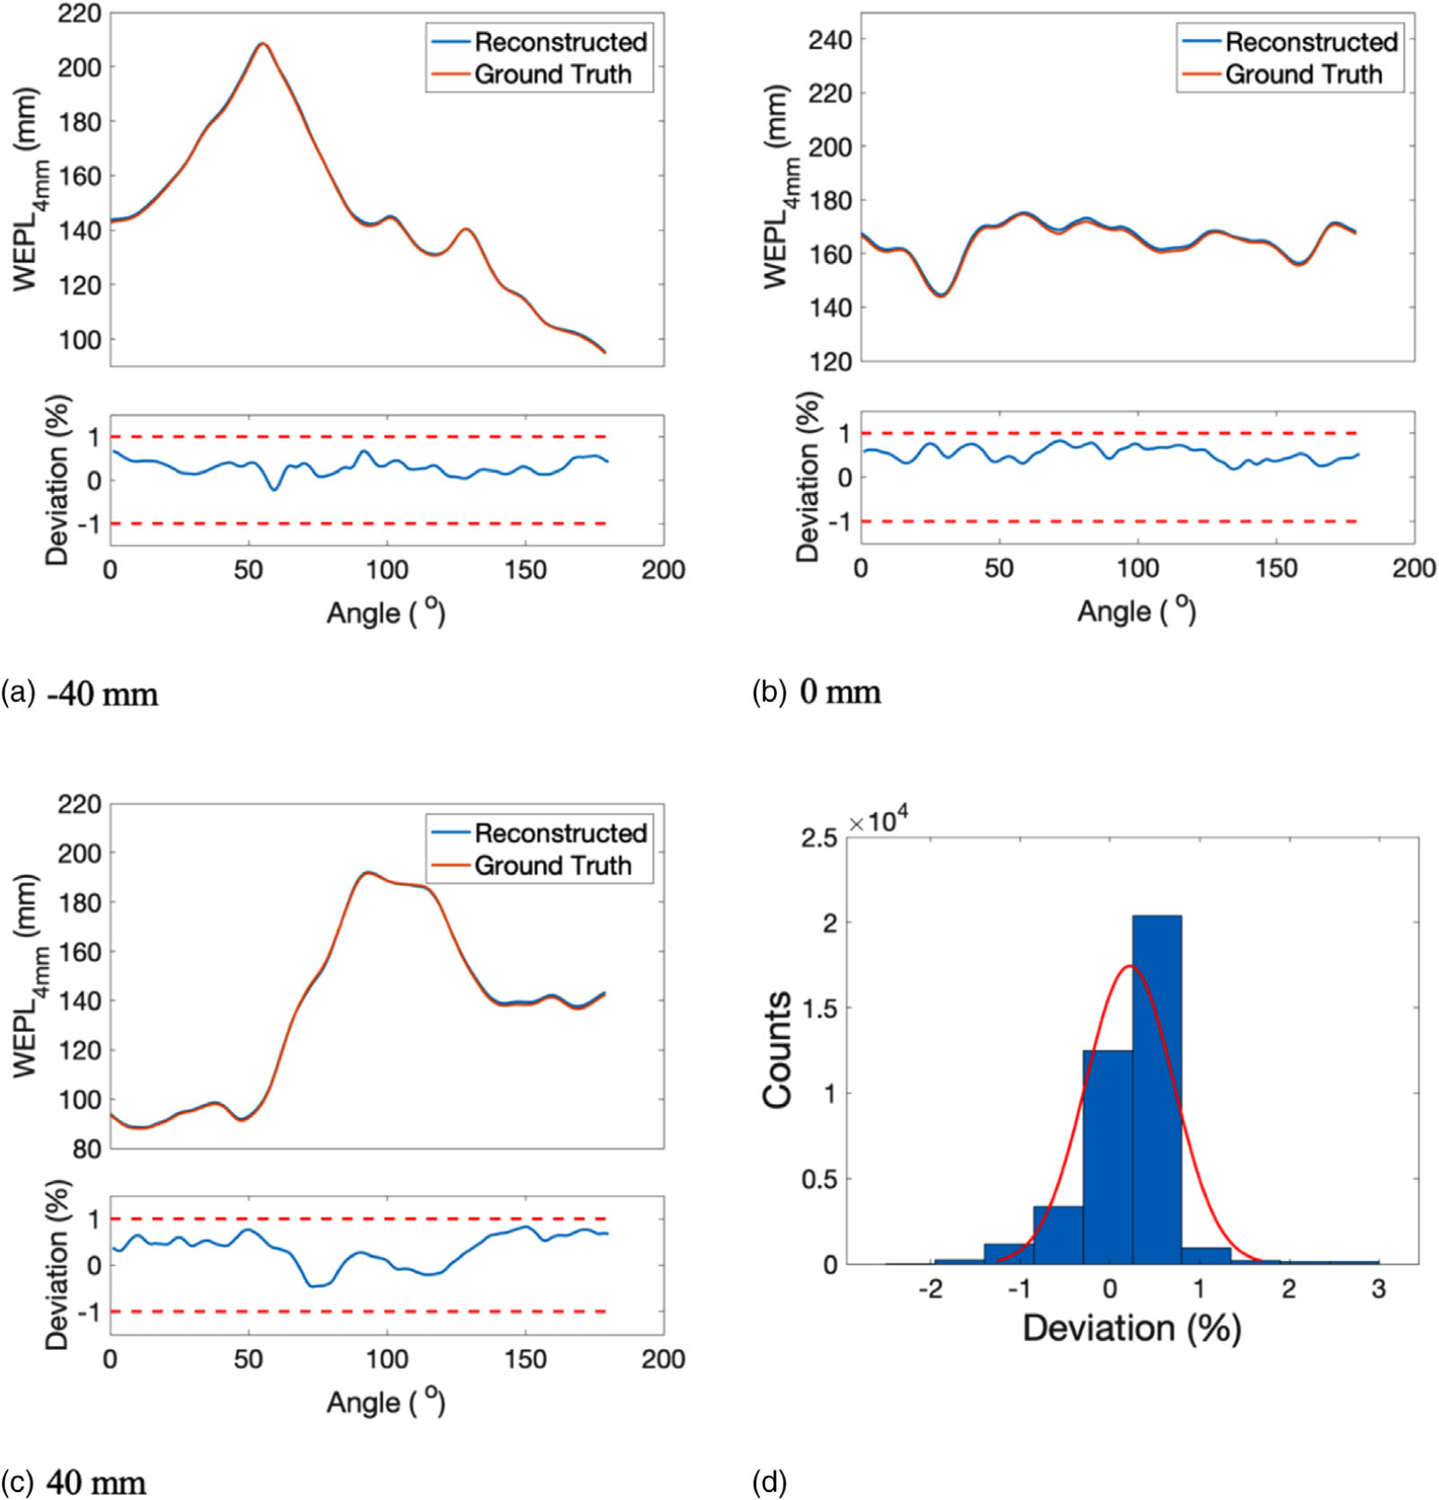
WEPL4mm of the reconstructed SPR and the reference SPR at beam offset of (a) −40 mm, (b) 0 mm, and (c) 40 mm. The corresponding deviation in WEPL4mm was displayed underneath each WEPL4mm plot. (d) Histogram of the deviations between the reconstructed and the reference WEPL4mm, which was fitted by a normal distribution illustrated by the red curve